My background is as a casualty actuary. I am used to looking at data from standard sources and trying to make some sense of it. I am hesitant to take someone else’s word for what the data show because I know that it is easy for mistakes to creep in. In this post, I will provide observations based on data from the databases of the US Centers for Disease Control and Prevention (CDC) and the Johns Hopkins University. Hopefully, some of these observations will prove insightful.
I am aware that the proper reference for COVID is “COVID-19.” In this post, I have elected to use the shorter reference, except when shown in an exhibit prepared using software developed by someone else (Figure 3).
[1] Recent data show that COVID vaccines don’t really prevent a person from catching and passing along the virus that causes COVID. The CDC has recently changed its guidance to reflect the fact that the vaccines mostly reduce the chance of severe illness. Vaccines are still recommended by the CDC, not because they reduce transmission, but because they may reduce COVID-related healthcare costs.

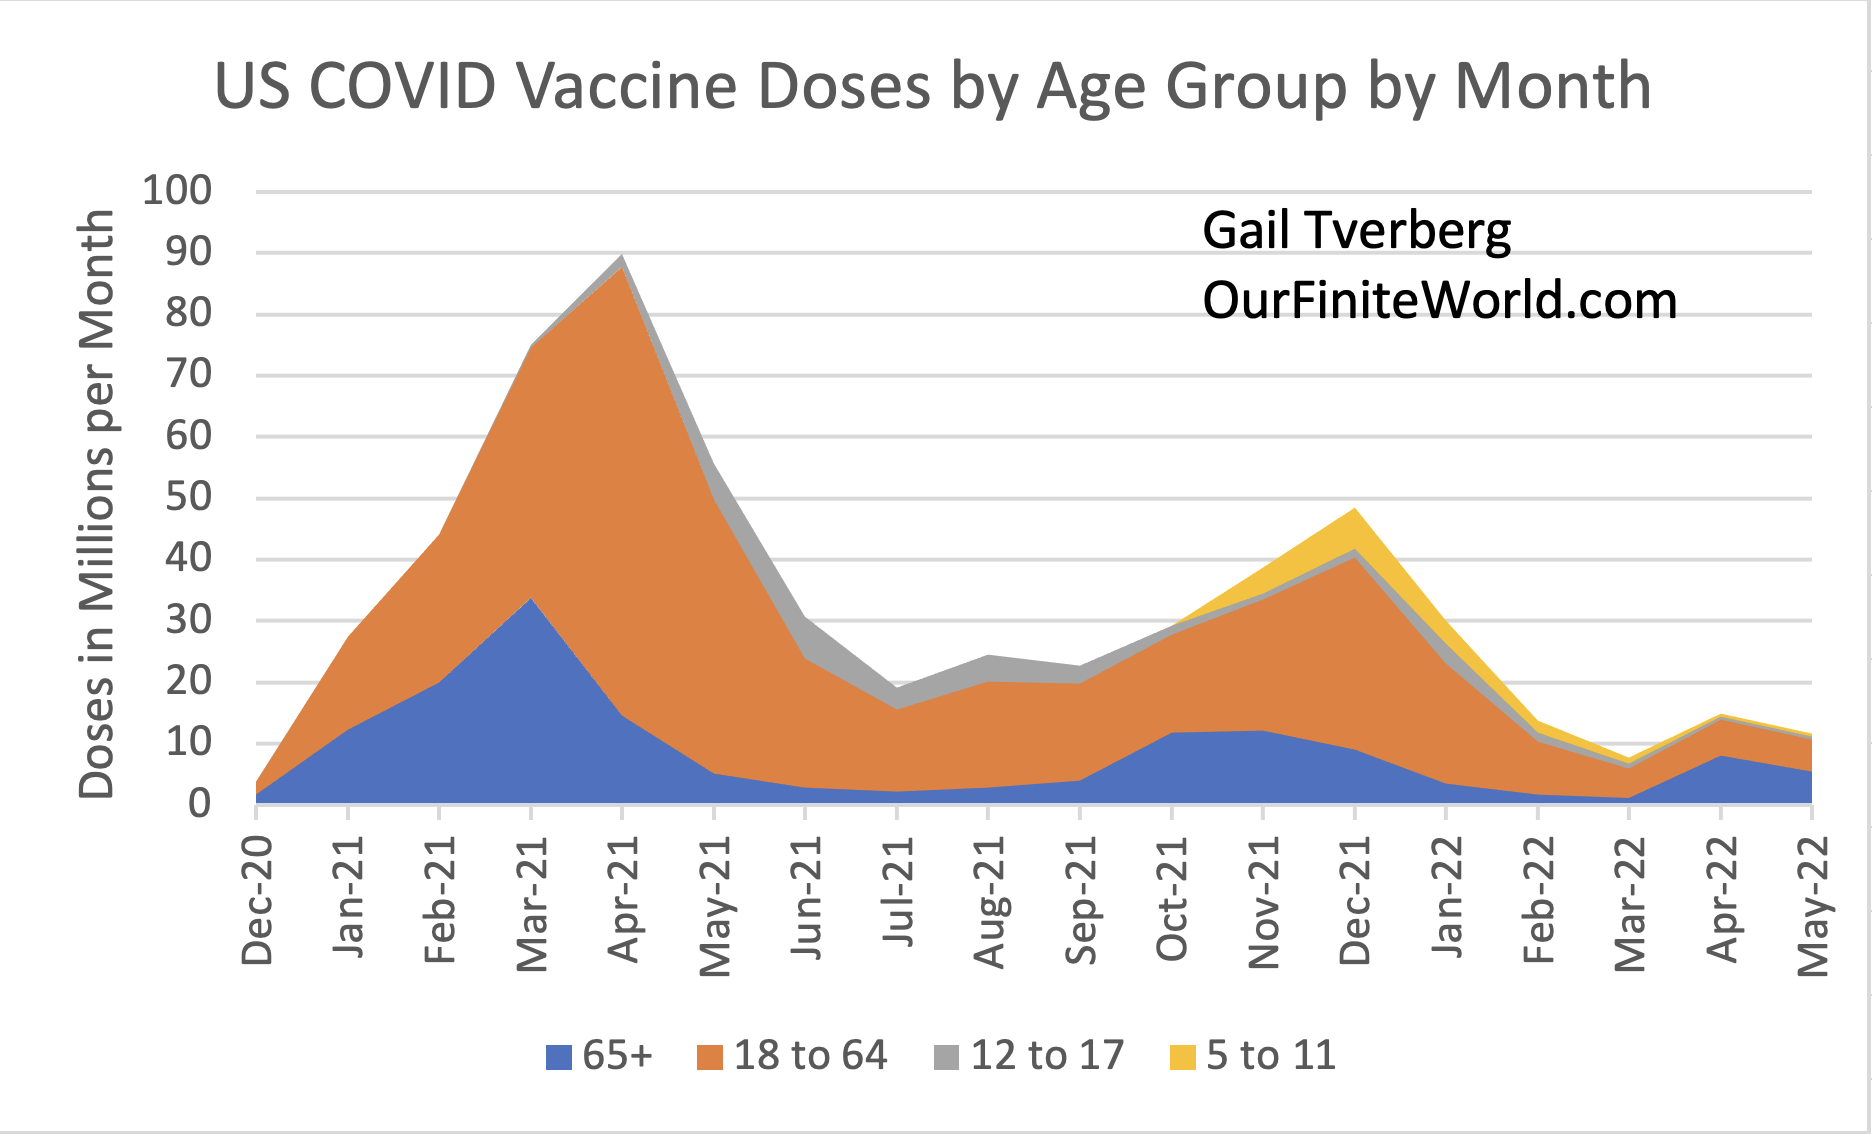
It is clear from Figure 1 that the big initial push for vaccine delivery peaked around April 2021. The rollout was substantially accomplished by July 2021. Then there was a second, lower peak related primarily to boosters in the November 2021 to January 2022 period.
Figure 2 shows the pattern of newly reported COVID cases, relative to the first round of COVID vaccinations, based on data reported to the Johns Hopkins University database.

Clearly, the first round of vaccinations did not put an end to new COVID cases. In fact, the CDC started becoming concerned about transmission among the vaccinated as early as July 2021. At that time, it started recommending that everyone wear a mask in conditions that represented high transmission. It also began using the term breakthrough infection to describe the (hopefully uncommon) condition of coming down with COVID after being vaccinated.
In fact, back when the Delta wave hit in the fall of 2021, it was possible to blame at least part of the problem on the lesser-vaccinated Southern part of the US. The well-vaccinated Northeast seemed to fare relatively much better (Figure 3).

Figure 3 indicates that a quite different situation occurred when the Omicron variant hit close to the beginning of 2022. The heavily vaccinated Northeast clearly led the way, both in timing and in the number of COVID cases relative to population. The relatively less vaccinated South was much lower, close to the Midwest in its number of cases, relative to population.
The Omicron variant is very different from the original Wuhan version of the virus. This difference between virus variants is as least part reason that current mRNA vaccines fail to block transmission of the Omicron virus. Instead, current vaccines mostly reduce severe symptoms. This is very similar to the explanation we have heard when getting influenza vaccines each year. Researchers make a guess with respect to which particular strains will be circulating the following year. The level of protection will vary, depending upon whether the researchers’ guesses prove to be accurate the following year.
There are also indications from patterns elsewhere (and from theory) that it is not good practice to vaccinate at the time a virus is already starting to circulate widely. The booster vaccinations that took place in November and December 2021 (Figure 1) may have inadvertently raised, rather than lowered, their recipient’s chances of catching COVID. But, of course, the illness would be (on average) relatively mild. This lower severity of outcome is to be expected, partly because the mutated virus seems to be less virulent than the Wuhan COVID virus, and partly because the vaccines tend to reduce the severity of the disease.
The CDC started moving in the direction of treating vaccinated and unvaccinated people alike back in July 2021. Now, with the evidence from the Omicron wave coming in, it has had no choice but to move even further in the direction of treating everyone alike. For example, for domestic travel, the CDC recommends tests for both vaccinated and unvaccinated travelers if there is a concern about COVID. Recent CDC recommendations with respect to the wearing of masks do not depend upon vaccine status, either.
The idea of requiring everyone to be vaccinated likely originated from the cost-savings and profits that were expected to occur if people could be vaccinated and kept out of hospitals. Employers were very much in favor of such cost-savings because their workers likely would be able to stay on the job more of the time. Insurance companies were in favor of such an approach as well, because it would lower health care claim costs. Hospitals and physicians were in favor of the recommended COVID vaccines because physicians could perform more elective surgery (and thus make more money) if the hospitals were not full of COVID patients. Of course, the drug companies selling vaccines were in favor of selling more vaccines, too.
Furthermore, we know from prior experience with viruses that the ability to stop transmission with a vaccine varies greatly from virus to virus. Forecasting that any proposed vaccine will prevent transmission is a very “iffy” proposition. The viruses that cause the common cold, HIV and SARS are related (in some way) to the virus that causes COVID. Despite decades of research, none of these viruses has a successful vaccine. This suggests that COVID cannot be stopped by a vaccine, either. We also know, in general, that if a virus jumps from an animal to human hosts, transmission can only be stopped if all of the animal hosts are successfully vaccinated, as well.
[2] COVID vaccines used in the US do not seem to have done much to reduce total COVID deaths.

Vaccinations started in December of 2020, but there were about 20% more COVID deaths in 2021 than in 2020. Part of the problem is that after the Delta peak in deaths in September, deaths never retreated to zero, or close to zero. COVID deaths immediately began increasing with the Omicron peak. While there was a lull during March 2022 in reported cases (Figures 2 and 3), data for April and May seem to indicate that reported cases are again on an upward path.
If today’s vaccines really worked as people initially hoped, I would expect to see a lot more progress in reducing new cases than shown to date.
[3] Data from OurWorldInData.org provides excess mortality indications for five age groupings. This data indicates that Ages 15-64 were particularly hard hit by the last two waves of COVID (Delta and Omicron). Ages 85+ were hit very lightly.

Since these charts are for all causes of death combined, they will reflect deaths that might have occurred due to other problems of the 2020 to 2022 period, in addition to COVID deaths. For example, increased suicides and homicides would be included, as would a rise in drug overdoses and motor vehicle accidents. If there are deaths stemming from the use of vaccines, these deaths would be included in the total deaths from all causes, as well.
The rise in deaths in the Ages 15-64 grouping is particularly striking. This group is known for being more likely to be depressed by the events of the day. The base number of expected deaths is relatively lower than for the older ages. This allows the deaths from newly increased causes to magnify the total death rate of the period by a greater factor. Life insurance companies have been complaining about the high numbers of deaths experienced on their policies, predominantly for this age group.
The strikingly low deaths in the Ages 85+ group in 2021 may reflect the working of the vaccine. There might be other causes as well. Some of the weaker members of this group likely died in 2020, leaving fewer to die in 2021. This lower death rate may also reflect the impact of antibodies gained from catching COVID in 2020. People included in Ages 85+, more frequently than younger age groups, lived in care homes of various kinds during 2020. In this setting, they were more exposed to the early rounds of COVID than those living in home settings. Thus, they had more of a chance to develop antibodies from catching the illness.
[4] If we prepare charts showing provisional mortality data for 2021, together with similar indications for prior years, we can see how US mortality rates have been changing for different age groups. We can also see the relative role of COVID cases in these changes.

The CDC data show mortality rates based on deaths from all causes. For the years 2020 and 2021, it gives a separate indication of mortality associated with COVID. The orange line represents what the mortality would be if all COVID deaths (using a broad definition of COVID death, based on COVID appearing as “any cause” on the death certificate) were removed.
COVID vaccines were not available until mid-December 2020, and then for only a very small group, so the difference in the orange and blue lines at the 2020 point represents the number of COVID deaths for the age group, before the vaccines became available. The 2021 difference between the two lines represents the number of deaths from COVID taking into account whatever vaccines were used for this age group. We might expect the gap between the blue and orange lines to become smaller in 2021 than in 2020 if the vaccines given to the particular age group (or the prior antibodies from catching the illness) were making a significant change in reducing COVID cases in 2021.
Looking at Figure 6, COVID has essentially no influence for babies under Age 1. The total number of deaths seemed to drop more than usual in 2020, perhaps partly because mothers were at home more. For Ages 1-4, death rates are up in 2021, but not because of COVID. COVID seems to play practically no role in the mortality of Ages 5-14 and at most a very minor role for Ages 15-24. For the latter group, mortality is significantly up in both 2020 and 2021, perhaps because of more suicides and risky behavior resulting in death (such as car accidents and drug overdoses).

We can see similar patterns to what we saw for Ages 15-24 in the chart above, but with progressively more COVID in the mix of causes leading to the uptick in the overall death rates. The share of COVID cases in the mix rises in 2021 relative to 2020 for all of these age groupings, despite the vaccines and prior immunity which should start building up (if immunity is truly “durable,” something that is not always the case).

It is only when we get to these oldest ages that death rates stop increasing in 2021. In fact, when the impact of COVID deaths is removed, the death rates seem to be improving. These age groups tended to get the vaccine early. They also lost quite a few sickly members in 2020, when the first round of COVID hit. The remaining group may be in somewhat better health than the original mix. Also, as mentioned in Section [3], they may also have more antibodies from actually catching COVID during 202o, while living in a care home.
[5] We can perhaps get an inkling of what is going wrong with death rates by comparing deaths by cause for January 2020, January 2021, and January 2022, based on monthly provisional death data.
A sample of one month is not very much, but January tends to be bad for mortality because the cold weather encourages dry indoor conditions, especially in the colder parts of the country. People tend to stay inside more because of cold weather. Vitamin D levels tend to be low because of lower sunlight exposure. Communicable disease deaths, including those of COVID, tend to be high at this time of year.

Looking at Figure 9, the first thing we notice is that total January 2022 deaths from natural causes are still outrageously high compared with January 2020 deaths. These deaths exclude deaths from suicides, drug overdoses, car accidents and many other unnatural causes that we know are trending up substantially, so the overall situation is probably even worse than natural death indications would suggest.
One thing we notice is that heart disease deaths seem to be trending higher. This could be a fluke, or it might be caused by COVID or the vaccines (or both). Investigation might be useful.
Cancer deaths, at least based on this tiny sample, seem to be flat. This suggests that fears of a rapid rise in cancer deaths because of vaccine-related issues may be unwarranted.
COVID deaths in January 2022 are down from their very elevated level in January 2021.
Cerebrovascular diseases, diabetes and kidney disease deaths all are higher, in this very small sample. These diseases would all seem to possibly be influenced by a greater number of COVID cases or perhaps by side effects associated with vaccines or with treatments. Researchers interested in these topics should be aware that data are being collected that might give insight into changes in the number of deaths associated with these causes.
One thing that alarmed me when I looked at the CDC’s list of “selected” natural causes is that the list of diseases for which data is given is not very complete. One grouping that clearly has been omitted is diseases of the liver. I would strongly suspect that deaths from diseases of the liver are rising, if people have been staying at home and drinking more alcoholic beverages.
[6] Conclusions and ideas for further examination.
Clearly, the CDC has a huge quantity of data that can be examined if anyone wants to put the time and energy into looking at it. Too often researchers coming from the biological sciences do not stop and think about using whatever data is available to support or refute their ideas, at least based on the evidence to date.
The significant increases in mortality for the many age groups between 15 and 64 would seem to suggest that something is going badly wrong. Someone should be examining these changes. If part of the problem is that vaccines are having serious side effects, this can perhaps be seen by analyzing deaths by cause for these age groups.
The lack of COVID cases in the youngest age groupings (babies and Ages 1-4) would suggest that vaccines are not really needed for these age groupings. Babies don’t excessively fill hospitals with COVID cases. Training their immune systems to look for a long-extinct version of the virus cannot be very helpful in the long run.
If the underlying purpose of vaccines is to help the profitability of big companies, hospitals, doctors and vaccine-makers, this makes a big difference in our understanding of what we are being told. Clearly, the government is also a big employer; its ability to stay within its budget is enhanced by holding down the hospital and other medical costs of its employees. For example, if the government wants the hospitalization costs and work lost by those in the US Army and US Navy to be as low as possible, it will mandate vaccines for these employees. The CDC, being a government agency, cannot help but be at least somewhat influenced by what government leaders are demanding when interpreting scientific evidence.
The government cannot explain that the reason it wants everyone to be vaccinated has essentially nothing to do with disease transmission, without upsetting many people, so it publicizes its change in stance with respect to vaccines as little as possible. Businesses do not want it known that their reason for demanding vaccines is to hold down their own COVID healthcare costs, so they are not anxious to publicize the underlying reason, either. Thus, the vast majority of citizens are not aware of the fact that even with boosters, their chance of catching COVID and passing it along to others is still very high. Studies seem to indicate that boosters may provide an individual person with a short window (6 weeks, or so) of lower likelihood of catching COVID, but the overall effect is not enough to reduce the overall pattern of disease transmission.
If a vaccine against Omicron is developed, we need to be aware that there is a high probability that by the time the vaccine is widely distributed, the virus will have mutated sufficiently that its only benefit will be to somewhat reduce the severity of whatever version of COVID is prevalent at the time the next wave of cases appears. Thus, we cannot hope that with a better-directed vaccine, it will make any substantial difference in disease transmission. Thus, we should expect that the major benefit will always be “reduced healthcare costs with respect to COVID.”
There are quite a few people who have discovered from reading on-line articles that there are ways of potentially reducing the severity of COVID besides receiving the vaccine. These include raising vitamin D levels in advance of contracting COVID and taking any number of common, inexpensive drugs (including aspirin) if the disease does hit. They also recognize that the long-term effects of the vaccines are unknown. For example, if repeated too many times, the vaccines may damage the immune system, according to some analyses. The views of these vaccine-refusers need to be respected. The vaccine-refusers can easily be turned into scapegoats.