KWL & KWHL charts are graphic organizers designed to activate prior knowledge, promote higher-order questioning, and engage students in metacognition.
First created by Donna Ogle in 1986, they are formatted as 3- to 4-column charts, wherein KWL represents what I know, what I want to learn, and what I learned. With KWHL, an additional column represents how I plan to learn, so students are also thinking about ways of investigating and knowing.
Teachers can prompt students to begin a KWL chart at the start of an activity, directing students to complete the K and W columns. It’s also useful for teachers to model how to create effective questions using either Costa’s or Bloom’s question stems. Near the conclusion of the activity, the students can complete the L column, reflecting on what they’ve learned.
How Do KWL charts improve student learning?
The K column serves to activate students’ prior knowledge before introducing new content. Studies show that our brains learn more easily when we can connect incoming data to what we already know. When we generate prior knowledge, we essentially prime ourselves to receive new information through a particular lens, allowing data to move from short-term memory to long-term memory.
The W column is where teachers can challenge students to get curious by using higher-order questioning strategies. Specifically, we want students to wonder beyond what they can simply recall or recognize. We want them to identify what matters to them and encourage them to use what they already know to identify gaps in their knowledge or interesting connections.
According to one study, higher-order questions increase ‘neural branching,’ the stimulation of neural connections in the brain. This effect is the opposite of ‘neural pruning,’ in which our brain, by default, seeks to form mental habits and limiting patterns.
Higher-order thinking questions prompt students to synthesize, analyze, and make comparisons. If you think of a student thinking like an athlete lifting weights, then higher-order questions can be conceived as heavier weights that the athlete adds to the barbell. Sometimes the teacher (or coach) can stack those weights on, but ideally, the learner will become adept at learning how much to add on with practice.
The L column engages students in metacognition, which can lead to improved self-regulated learning outcomes during the teenage years, a time when middle and high school students’ academic achievement and intrinsic motivation decline. Research also shows that students who apply metacognitive skills to learning tasks outperform those who don’t apply those same skills.
Through prompting students to engage in metacognition – essentially, thinking about their thinking – teachers can bring a sense of individual or collective closure to a lesson.
How can I use KWL charts across content areas?
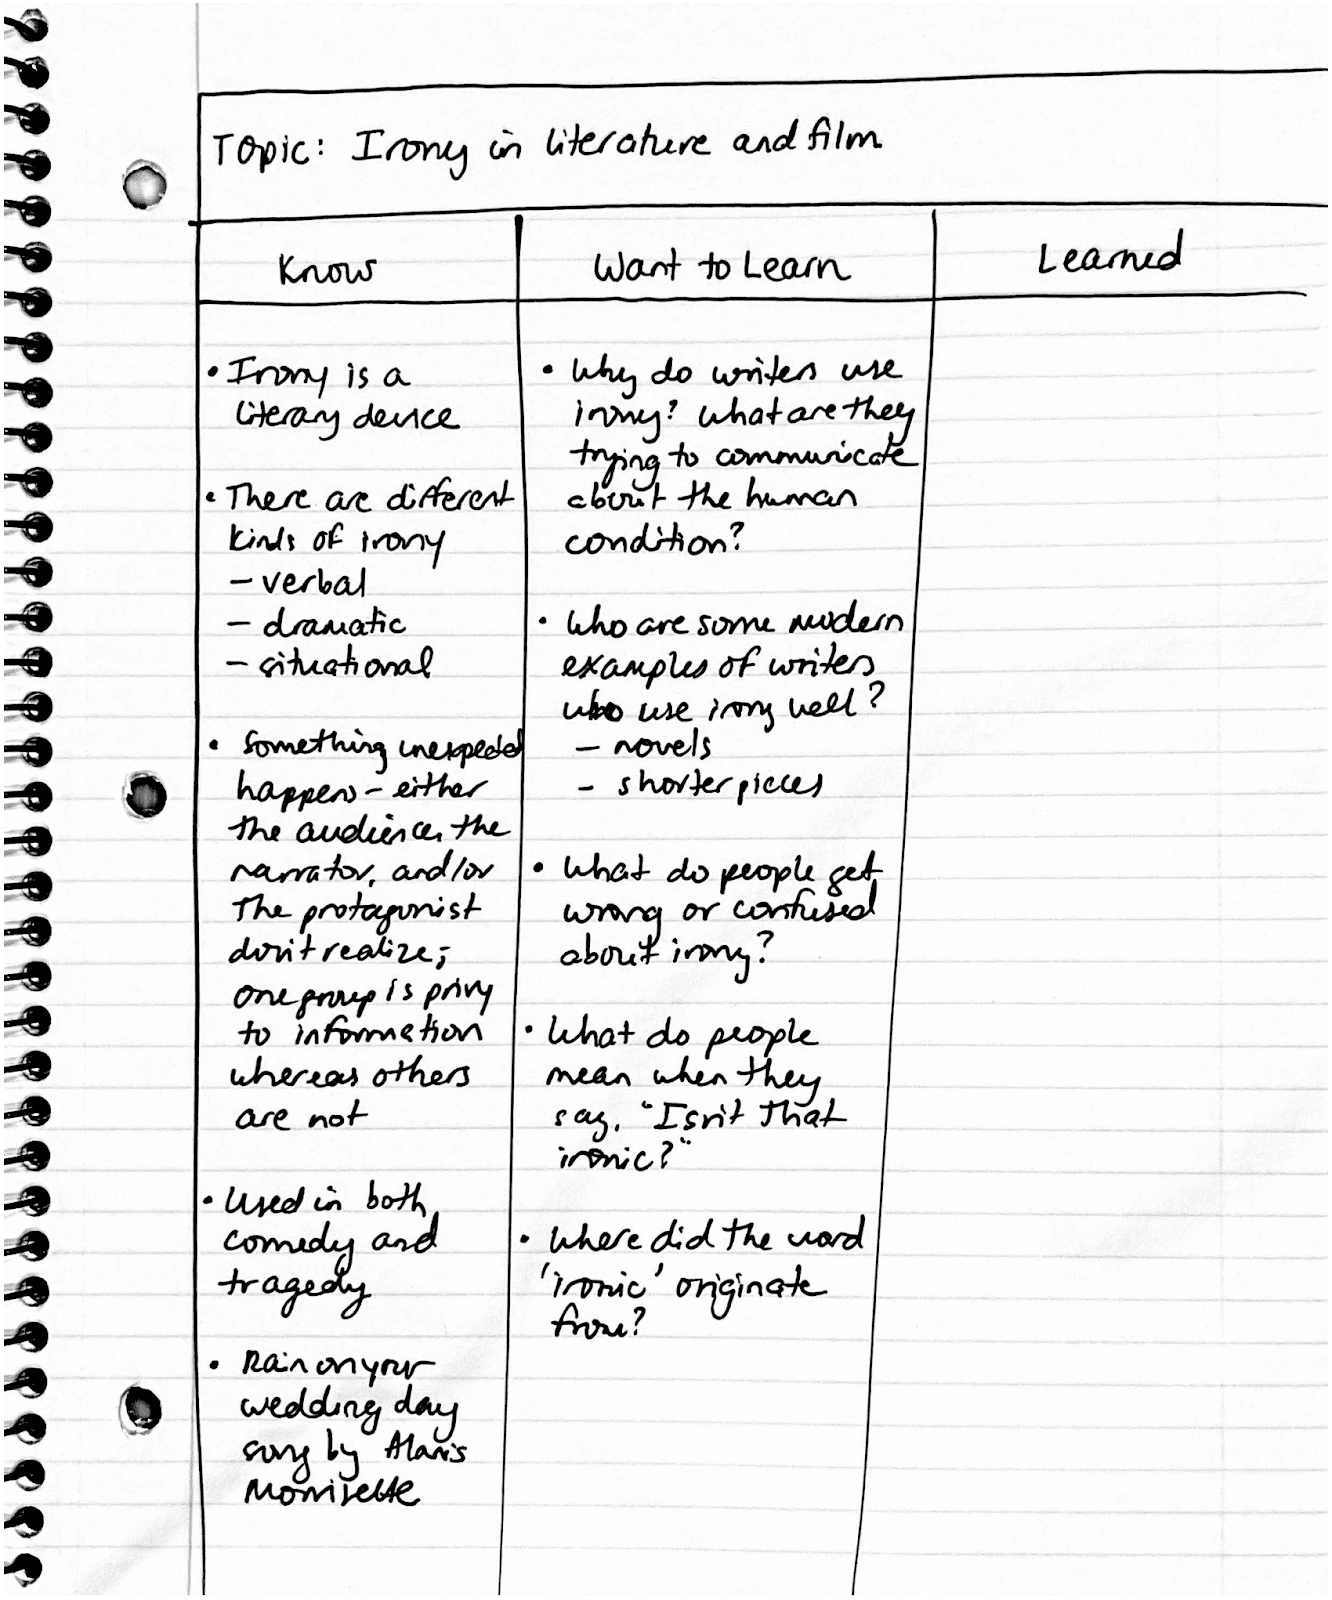
Start by adding a collaborative element to chart-making. Students can share what they know out loud to the entire class, within a small group, or with a partner. For example, if they’re about to read a book whose author relies heavily on irony, they could discuss other examples of irony in media and questions they have that go along with the topic.
In a remote learning environment, students can collaborate by creating, sharing, and commenting on each other’s Flipgrid video responses. This could be a useful strategy in a math class where students are tasked with designing an object using geometric concepts. Getting students to describe their process of brainstorming, creating, and testing a prototype is prompting them to engage in metacognition.
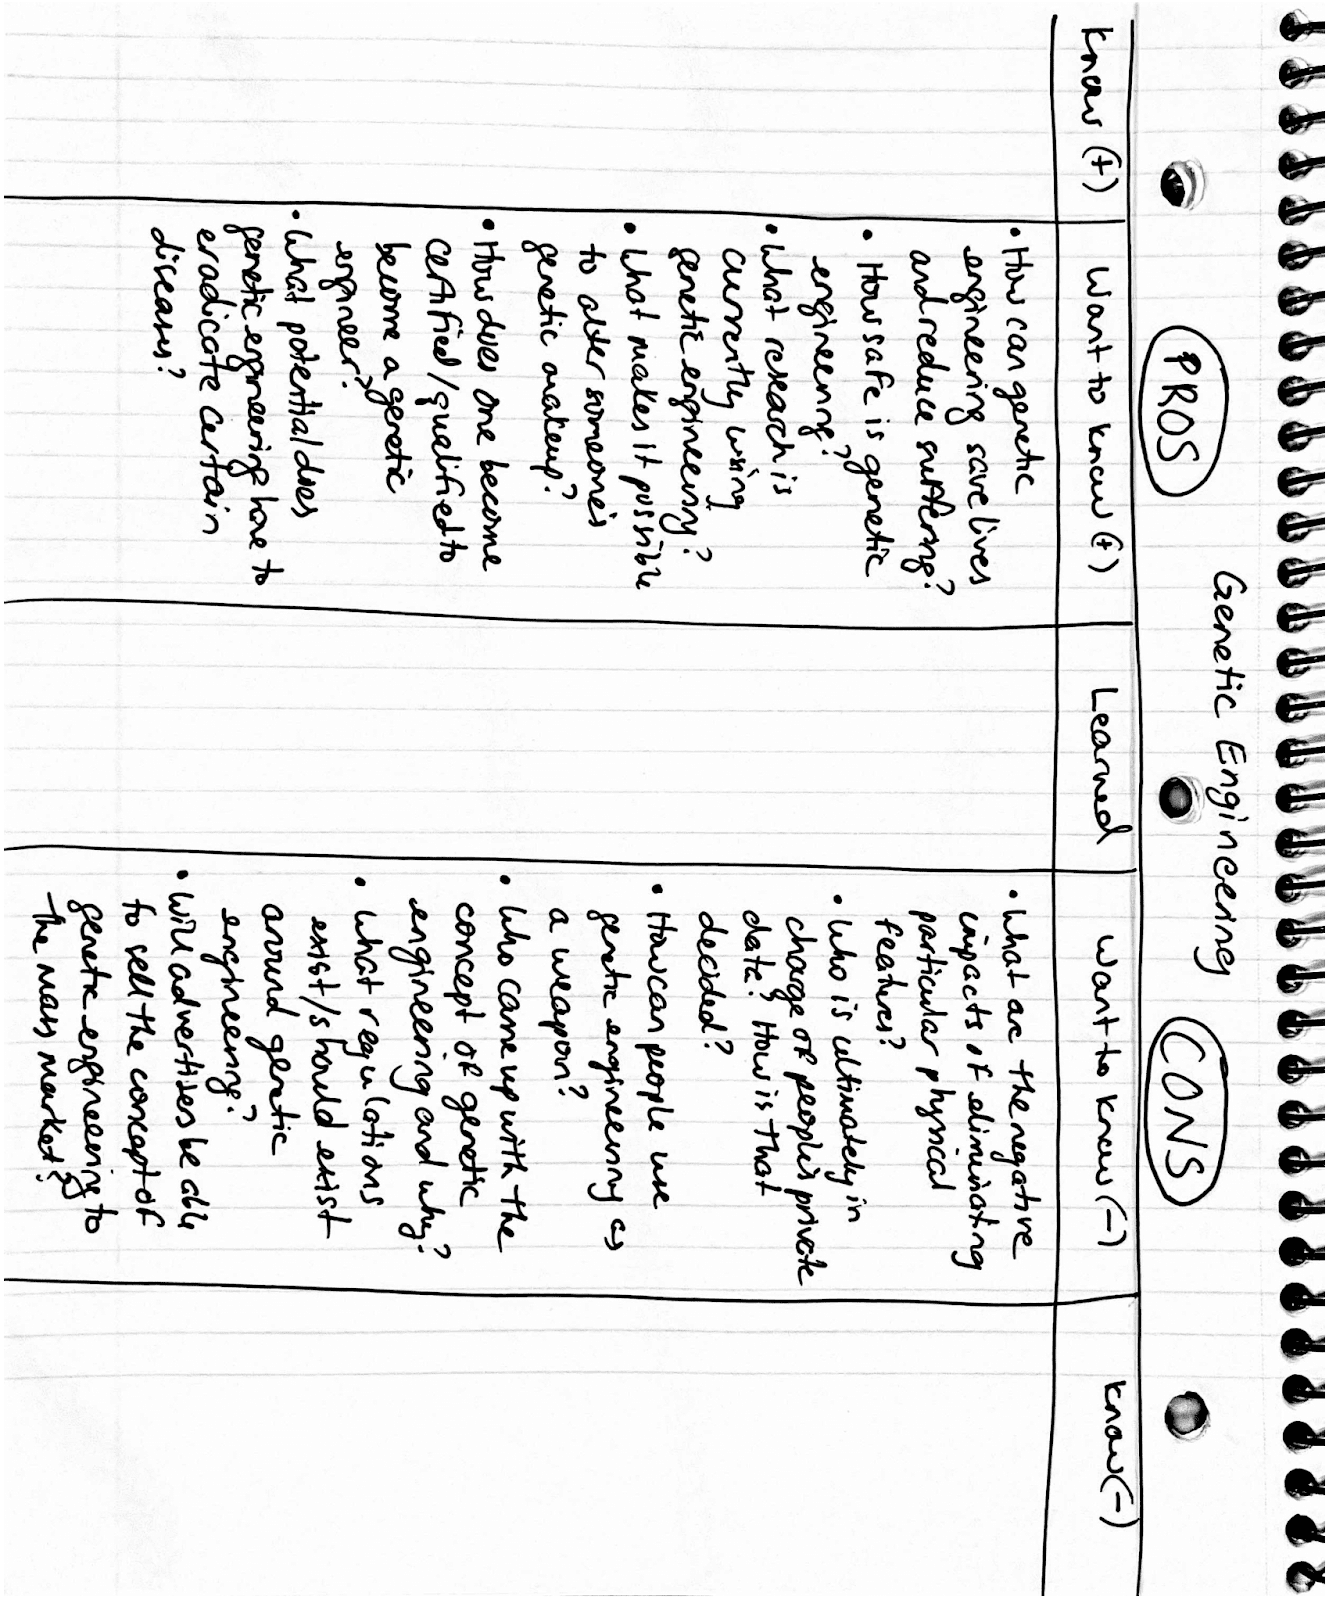
Let’s say that students in a biology class are discussing the ethics of genetic engineering – one half of the class will be responsible for making a positive argument while the other half will be tasked with making a negative argument for the case of genetic engineering. Students can use their notes from the K, W, and L sections as question stems or contributions for a Socratic seminar on the topic.
An Example Of A Completed KWL Chart (Filled Out)
KWL charts serve as great pre-writing tools in extended writing assignments. Students can generate essay topics or arguments from reexamining old questions, newfound understandings, and new questions. Alternatively, they can use what they know as evidence for a writing assignment or lab report.
There are many inquiry-based activities where KWL charts come in handy. Students can use questions from the W column to create a study guide for an assessment or identify further areas of investigation within a subject or topic. With more complex concepts, teachers can assign a “jigsaw” activity, wherein each student in a group is responsible for gathering, fact-checking, and reporting back knowledge on a sub-topic.
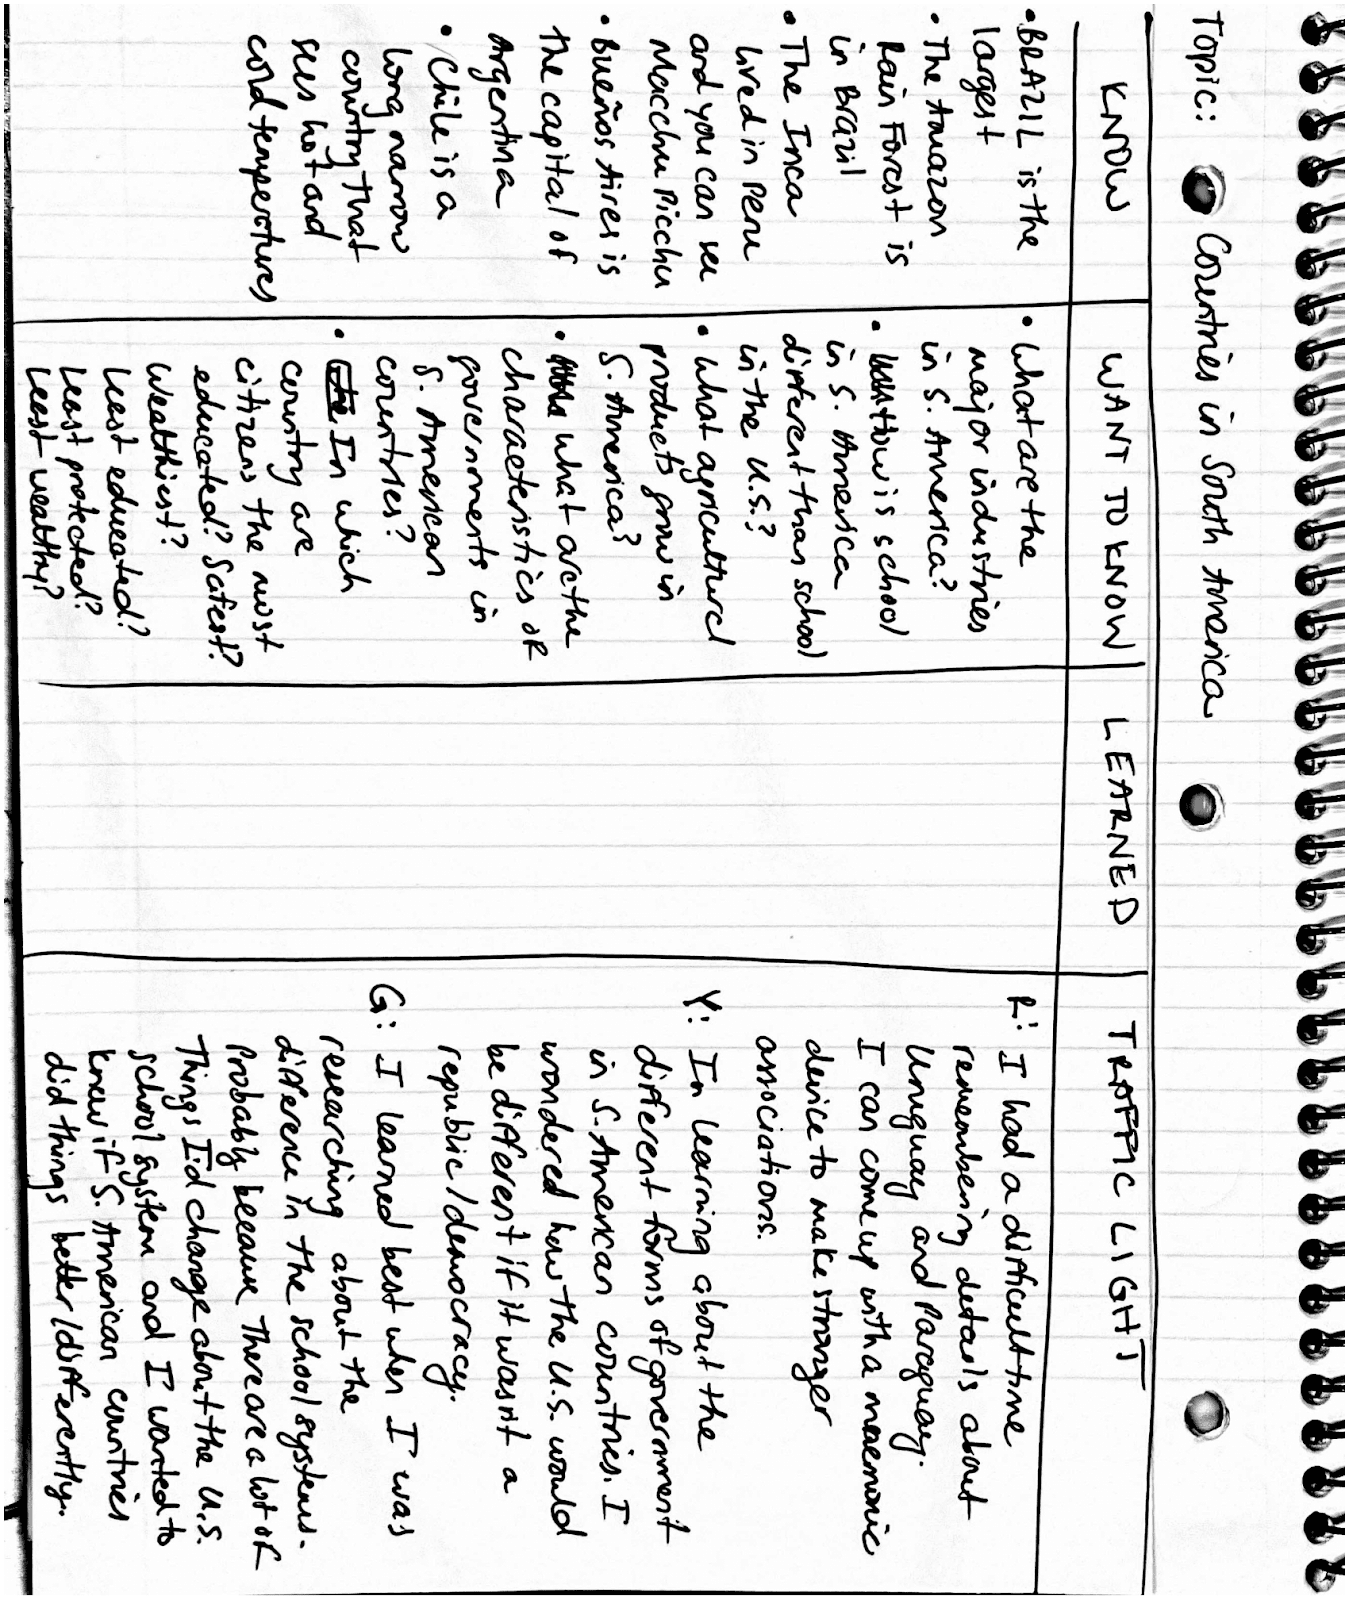
When it comes to metacognition, KWL charts can be used as exit tickets ‘Traffic Light’ tickets, wherein students write the following in the L column:
- Red = Where did I encounter a challenge?
- Yellow = What caused me to think differently about something?
- Green = When was I learning well?
We’ve included a KWL template below for your students to use in any subject area.
Free Blank KWL Charts To Download
You can also download a pdf version of the above black horizontal KWL chart here.
For a blank vertical KWL chart template pdf, see here.
What Is A KWHL Chart?
A KWHL chart is a variation of a KWL chart where an extra column is added for ‘How’: How can I learn this, How will I learn this, How I plan to learn this, How I’ll know if I’ve learned it, etc.