
Managing an ecommerce store requires careful planning and a comprehensive understanding of your past performance. You can not expect to maximize your results if you do not know your current state of affairs — a key reason to dive into WooCommerce analytics.
Reports and analytics give you the ability to dig into the details of what is driving your business.
They are invaluable tools for forecasting the future course of your business so that you can make the best decisions. In this post, we will examine how to monitor and customize your sales reports and analytics in WooCommerce to maximize the success of your business.
Get paid fast and keep more of what you sell
Keep more of what you sell — whether that’s online or in-person — thanks to the lowest payment processing rates in the industry. With GoDaddy Payments, you get the quick and easy way to get started, approved and taking credit card payments with no set-up fees, long-term contracts, or hidden charges.
You’ll only pay a low fee, starting at 2.3% plus $0.30 per transaction, and get your money the next business day.
And with the GoDaddy Payments Smart Terminal point-of-sale hardware, you can seamlessly manage your in-person and online transactions all in one place.
Sales reports from the WooCommerce Analytics dashboard
WooCommerce moved on from its prior sales reports to now include a new, more developed analytics dashboard for sellers. The updated dashboard has all the data and statistics in the form of various analytics reports in a flexible interface with improved functionality.
There are three main sections to the Overview page: Performance, Charts, and Leaderboard. You can customize each of the sections to show the metrics most relevant to your business.
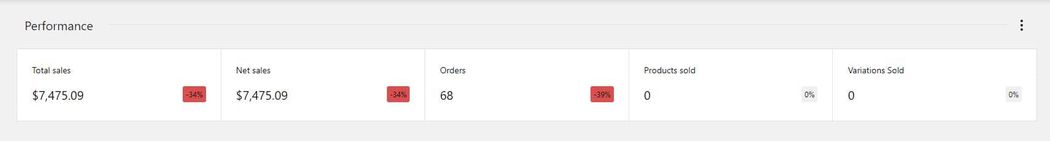
Performance
First, the Performance section. This displays scorecards for different metrics over the selected period. By default, the cards are set to display total sales, net sales, orders, products sold, and variations sold. Each metric has a red or green box highlighting the percentage change over the prior period.
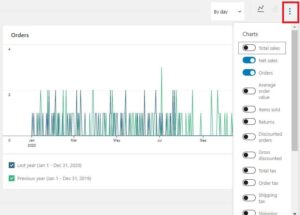
You can adjust these cards by clicking the stacked icon to the right of the header. This will pull up the various metrics you can choose from. There is also an option for you to change the name of the section.
Charts
In this section, you can visualize your important sales data through a series of charts and graphs.
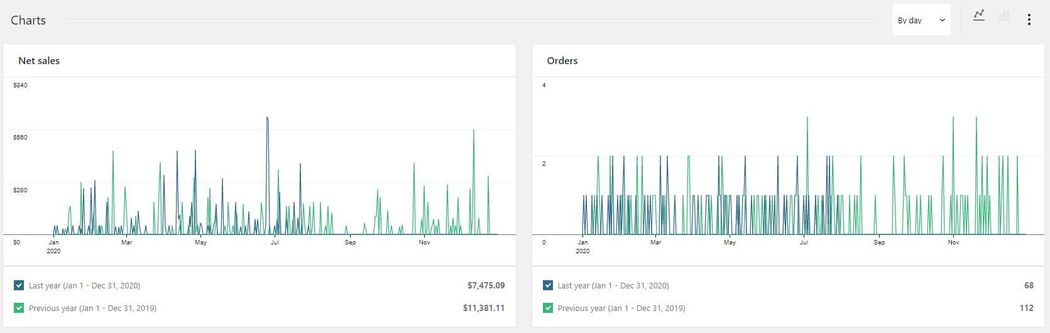
You can toggle the report by several metrics including total sales, orders, average order value, gross discounted amount, shipping, and downloads.
You can also select a comparison window for the charts. Your options are the previous period or the previous year.
The previous period will reflect the same duration you have selected for the date range. For example, if you select a range of one week, the comparison will show numbers from the previous week.
With the “Interval Selector,” you can adjust the interval displayed in the chart. The options depend on the length of the date range.
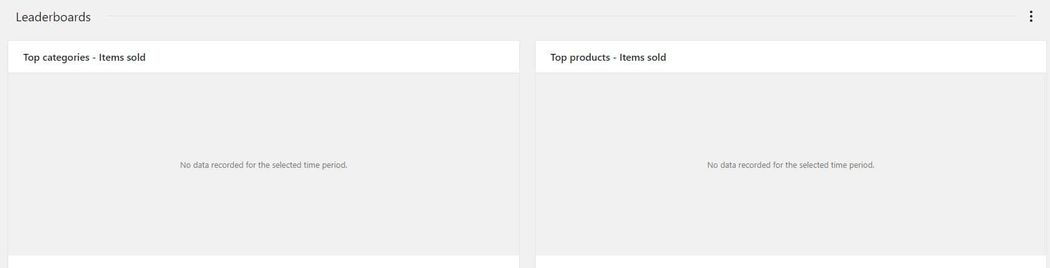
Leaderboards
Lastly, on the overview page is the Leaderboard. This section displays your top-selling items and categories over the chosen period. There are also leaderboards for your top customers as well as your top coupons.
This is an important section to review over time as it allows you to see how interest in certain parts of your offering trending whether positive or negative.
Configuring the WooCommerce analytics features
To customize your dashboard to your liking, there are several settings you can use.
Go to Analytics > Settings and from there you will see a list of excluded statuses and a list of actionable statuses. These will determine what type of orders are included in your report.
As you might guest, statuses checked in the excluded section will not be added.
Actionable statuses indicate those that require some form of action on your end as the store manager. For instance, an order that is marked pending as you wait for payment.
Depending on your business, you may choose to automatically include processing orders. So long as the payment is good, you can have the sale included in your data and then update the status when you ship the order.
The settings also let you set a default date range for the reports. If you have a routine of using the dashboard to review your weekly sales, you could set the date range to a week.
By default, the date range picker will show the data for the month to date. Some of the other date options you have are week to date, year to date, and quarter to date.
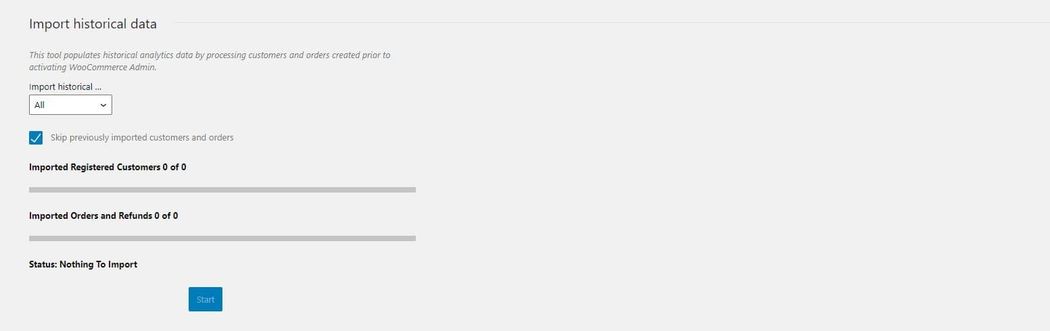
Import historical data
Finally, the Settings page gives you a useful tool for uploading your historical data. With this, you can add any previous transactions to your report to get a more detailed view of your business performance.
The data upload process is manual, as it can be quite thorough.
When you upload the file you can choose to only include data beyond a certain date. Otherwise, all the data included in the file will be imported.
If you have very high levels of data to import, you can benefit from dividing the upload into increments Additionally, there is an option for you to skip previously imported customers and orders. With this, you can upload overlapping data ranges much more efficiently.
When you add the file, the counts for customers and orders will update in real-time.
WooCommerce analytics reports
Products report
The products report displays a graph of your items sold over the selected period. Below, there is a table that provides detail into the performance for each individual item.
With this report, you can get a better understanding of your best-performing products, allowing you to plan you inventory more effectively.
Categories report
The Categories report gives detail into how the different types of items perform. It includes metrics like Items Sold, Net Sales, # of unique products sold, # of orders containing a product in that category. The default sorting lists the categories by the number of items sold.
Products that belong to multiple categories will be included in the reports for all of them. Sales for child categories are shown in the report for the parent category as well.
If your store, has a lot of different categories, it can be more difficult to quickly find the information that you need.
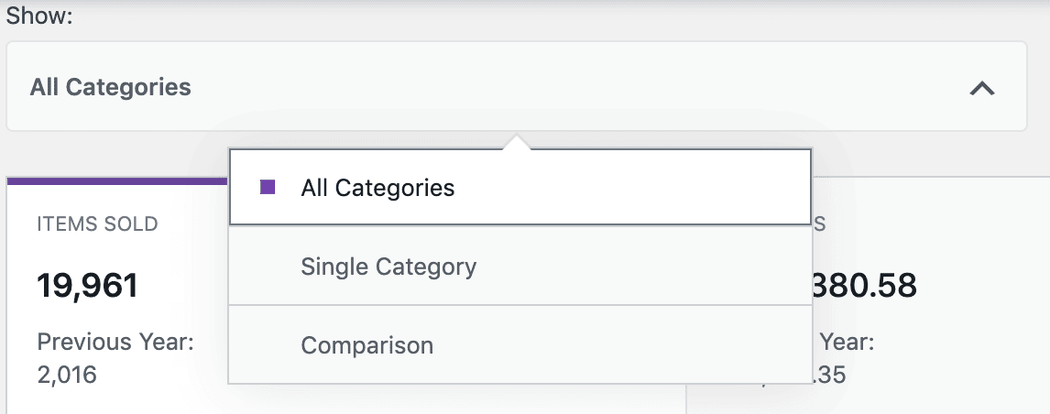
To refine the reports to a certain category, you can use the filter. The default layout will show all categories.
To view a specific category click into the box under Show, and then select Single Category. Begin to type the name of the category and the display will show any matching answers. Once you select a category, the summary numbers and the charts will update accordingly.
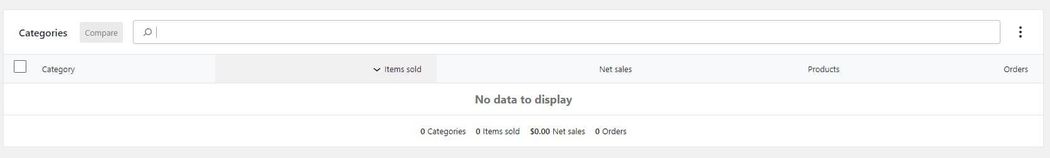
Another way to locate a particular category is to use the search bar. Like the parent filter, the matching options will appear as you begin to enter your characters.
Customers report
The customers report provides detail into the profiles of your buyers. It shows their location, registration date, the total amount spent, and other key metrics. The report displays both registered accounts and guests. If a customer completes multiple guest checkouts using the same email, the data will be combined into a single profile.
Orders report
The Orders report is where you can review stats for the purchases in your store. The layout is similar to the other reports. The default layout will show all products. To find a specific order or type of order click the show window and select Advanced filters.
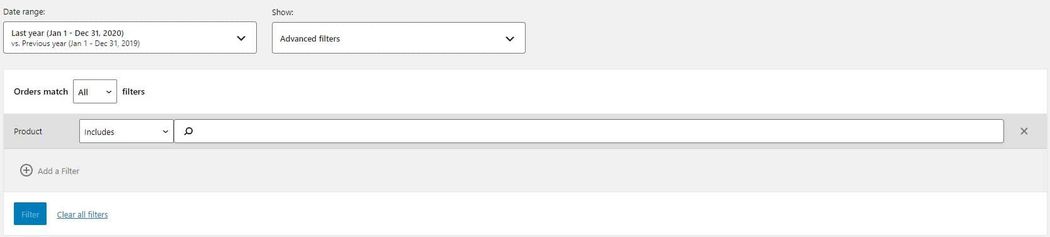
For example, if you only wanted to view orders that contain a particular product you can add a products filter. You would then set the filter to include and enter the product into the search.
In the table beneath the chart, you can see the order status, customer type (new or repeat) the number of items in the order andy any coupons that were used.
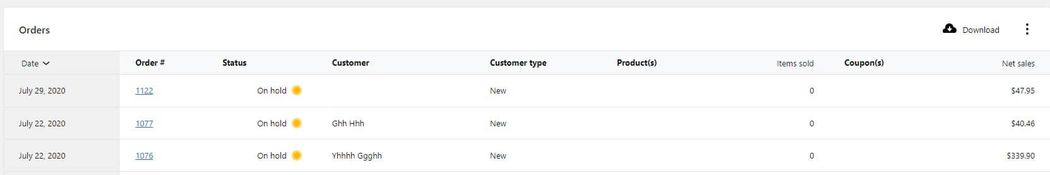
By default, orders are listed by order date descending. You are unable to exclude refunded orders from the report.
WooCommerce analytics web applications
Another way to build out reports for your WooCommerce store is to use a standalone analytics application. In addition to enhanced features, third-party web apps often have a user interface that is easier to navigate
Additionally, using a WooCommerce analytics app offers several advantages over plugin alternatives. They receive frequent updates from developers ensuring that you do not run into any issues when managing your store. There are often additional tools and more flexibility for arranging your charts.
A few of the more popular options include Metorik, Metrilo, and MosterInsights. Below we will walk through how to quickly set up Metorik to get access to enhanced reporting for your store.
Setting up Metorik for WooCommerce
Metorik gives your WooCommerce store a robust real-time dashboard to connect your store’s orders, customers, subscriptions, products, and other essential data.
To connect Metorik to your store go to the Metorik homepage or to the page for the WooCommerce extension. The latter ultimately redirects you to the sign-up page on their site.
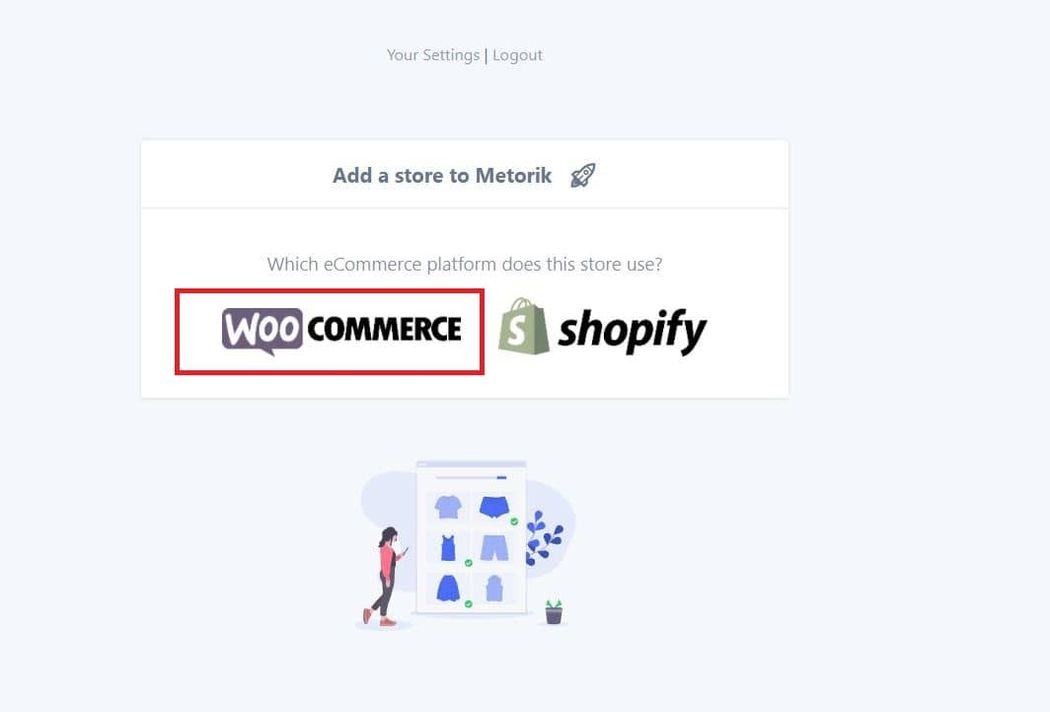
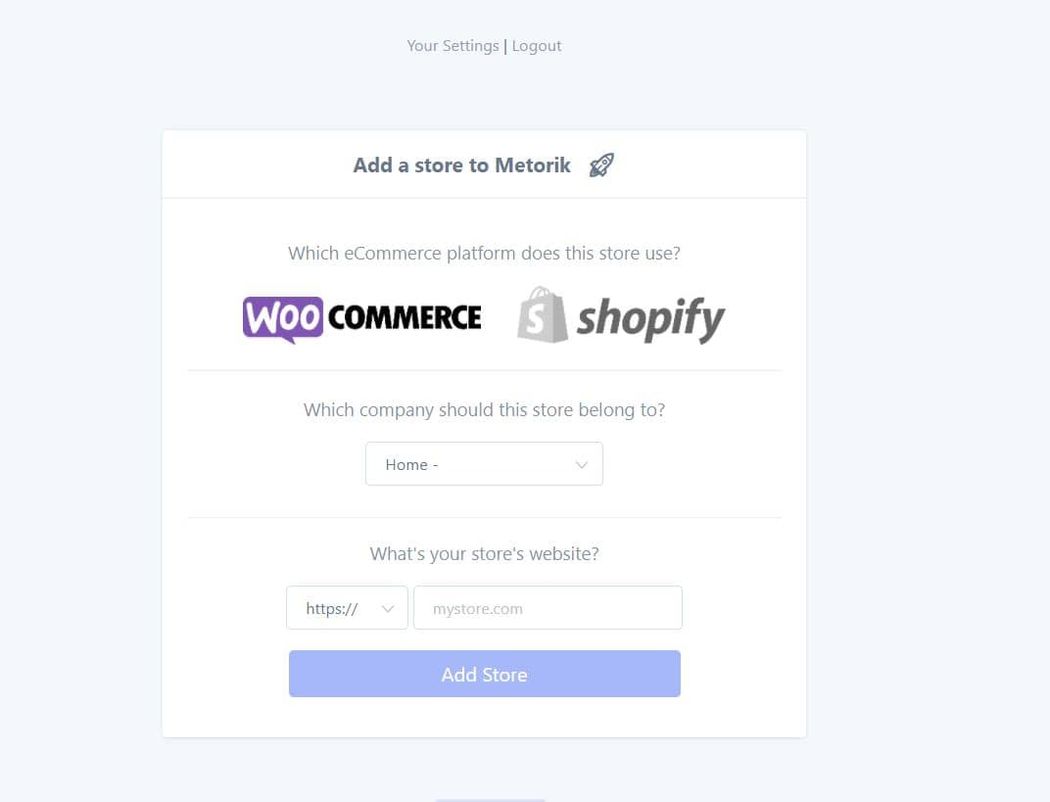
Enter your email and Metorik will send you a verification message. After you confirm this message, you will receive a prompt to connect your store to the app. Select WooCommerce as your ecommerce platform.
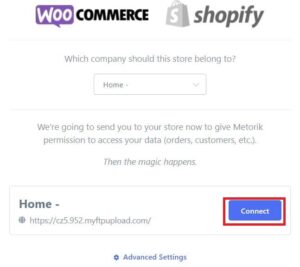
You will then need to enter your store URL and company name.
The app will quickly test the site to ensure that it is compatible. Once it does, click Connect to begin the integration.
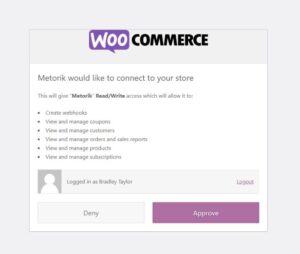
Next, you will approve the read/write permissions.
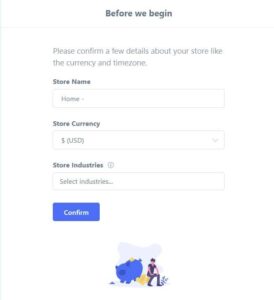
If all goes well, the connection will finish without issue. Once it does, you can enter a few details about your store including your store name, timezone, and currency.
The final step is to install the Metorik Helper plugin. If you have not already added the plugin, you can do so from the following page after confirming your details.
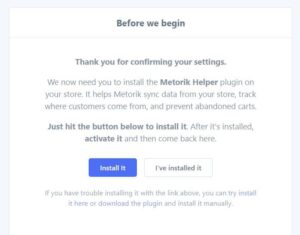
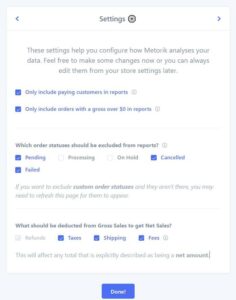
After you install the plugin click I’ve installed it. The app will confirm that the helper is installed. Once this is complete, there are a few settings you can configure for your store.
This includes the ability to add team members to receive updates. You can also integrate other apps and third-party tools such as Google Ads, Slack, and Google Analytics.
While completing the store setup, it is recommended that you enable Cart tracking.
Finally, you need to confirm which order statuses to include in the reports.
Reports and features in Metorik
With the setup complete, you can begin reviewing your sales data from the Metorik dashboard. From there you will see much of the same reports in the WooCommerce dashboard including those for orders, customers, products, and sales.
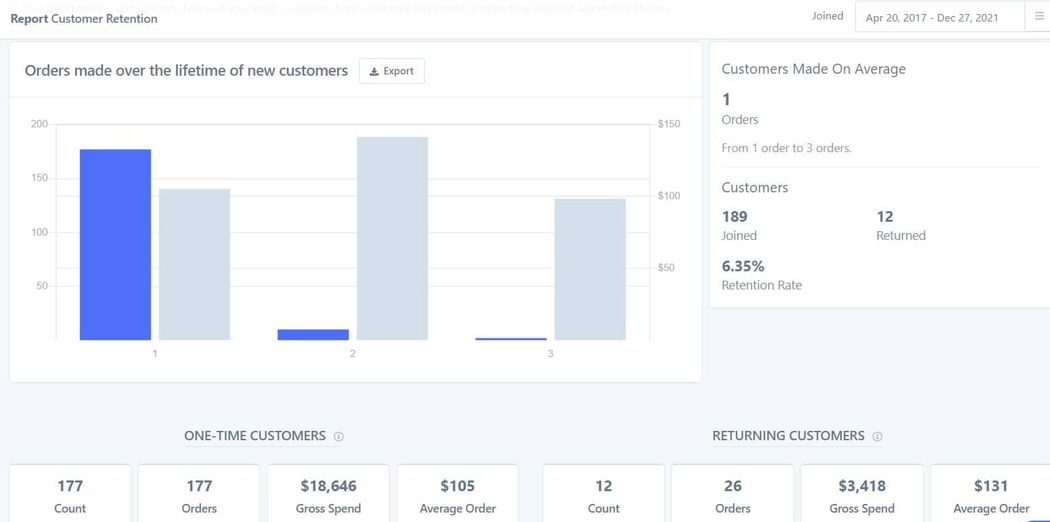
There are also additional reports that provide valuable insights into your audience. For example, with the Customer retention report, you can see what percentage of your orders and revenue come from repeat buyers
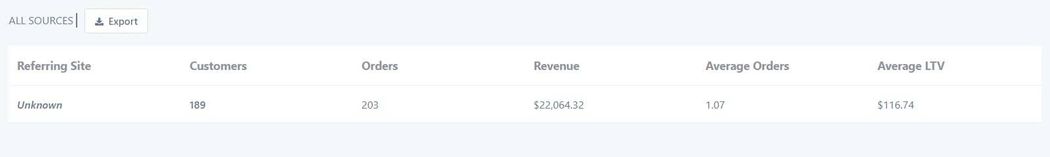
Or with the Customer Sources report, you can see how much revenue is generated from each of your traffic sources.
The platform integrates nicely with other WooCommerce extensions, for instance, the WooCommerce Brands plugin. With this plugin, you can add brands as a unique attribute for your items. Customers can use these to easily shop by their favorite company.
By integrating the with extension, Metorik lets you create a brands report to get a detailed breakdown of your performance across brands.
Another example is the products bundle extension. With this plugin, you can group products together to give customers a quick option for selecting multiple items. These could be discounted or sold for the normal price. With Metorik, report you can get a detailed analysis of how the products are sold.
Impact on performance
Now, you may be wondering if using an external WooCommerce analytics platform will impact your site’s performance.
For example, Metorik tracks a customer’s cart events and sends them to their platform. To do so, they make use of AJAX requests after the page has loaded It is done in the background so should have no impact on the customer experience.
How long the request takes will depend on your server location. It can take up to a couple of seconds to complete.
Metorik won’t send any requests when the customer checks out. This helps ensure that the checkout process is as smooth as possible. The platform has other ways to sync your store data and can do so after the transactions have been completely processed.
Closing thoughts on WooCommerce analytics
The pre-built WooCommerce analytics will give many sellers the insights needed to manage their business. For others, you may want a more robust interface and options for visualizing your important sales data.
This article lays out the key steps to implementing a powerful third-party reporting platform. There are other methods you can employ. Like syncing your data to Google Sheets and building your own models or using a WordPress plugin.