It’s been a year since our last report on the O’Reilly learning platform. Last year we cautioned against a “horse race” view of technology. That caution is worth remembering: focus on the horse race and the flashy news and you’ll miss the real stories. While new technologies may appear on the scene suddenly, the long, slow process of making things that work rarely attracts as much attention. We start with an explosion of fantastic achievements that seem like science fiction—imagine, GPT-3 can write stories!—but that burst of activity is followed by the process of putting that science fiction into production, of turning it into real products that work reliably, consistently, and fairly. AI is making that transition now; we can see it in our data. But what other transitions are in progress? What developments represent new ways of thinking, and what do those ways of thinking mean? What are the bigger changes shaping the future of software development and software architecture? This report is about those transitions.
Important signals often appear in technologies that have been fairly stable. For example, interest in security, after being steady for a few years, has suddenly jumped up, partly due to some spectacular ransomware attacks. What’s important for us isn’t the newsworthy attacks but the concomitant surge of interest in security practices—in protecting personal and corporate assets against criminal attackers. That surge is belated but healthy. Many businesses are moving IT operations to “the cloud,” a shift that’s probably been accelerated by the COVID-19 pandemic. What does that mean for the way software is designed and built? Virtual and augmented reality are technologies that were languishing in the background; has talk of the “metaverse” (sparked in part by Mark Zuckerberg) given VR and AR new life? And it’s no surprise that there’s a lot of interest in blockchains and NFTs. What does that mean, and how is it affecting software developers?

Learn faster. Dig deeper. See farther.
To understand the data from our learning platform, we must start by thinking about bias. First, our data is biased by our customer base. Of course. There’s no sampling error; all of our customers “vote” with the content they use. You could read this as a report on the biases of our customer base. Our customer base is large and worldwide (millions of developers, from well over 100 countries), but we won’t pretend that it’s representative of all programmers and technologists. While our customers include many individual developers, contractors, and hobbyist programmers, commercial (enterprise) software developers are very heavily represented—although there are certainly areas into which we’d like more visibility, such as the crucial Asia-Pacific software development community.
We used data from the first nine months (January through September) of 2021. When doing year-over-year comparisons, we used the first nine months of 2020.1
We looked at four specific kinds of data: search queries, questions asked to O’Reilly Answers (an AI engine that has indexed all of O’Reilly’s textual content; more recently, transcripts of video content and content from Pearson have been added to the index), resource usage by title, and resource usage by our topic taxonomy. There are some important biases here. If resources don’t exist, our customers can’t use them. To take one example, at this point, the platform has no content on the QUIC protocol or HTTP/3. Regardless of the level of interest, usage for these topics is going to be zero.
Search queries behave differently. Users certainly can search for content that doesn’t exist, so searches can be a good leading indicator of technology trends. However, most searches on our platform are single-word terms: users search for “Java” or “Python,” not “How do I use the Decorator pattern in C++?” (O’Reilly Answers is a great resource for answering questions like this.) As a result, the signals we get from looking at searches aren’t very granular. Answers could provide additional granularity, since users ask full questions. But Answers is a new service, only released in October 2020. So while we can discuss whether Answers usage is in line with other services, it’s difficult to talk about trends with so little data, and it’s impossible to do a year-over-year comparison.
Content usage, whether by title or our taxonomy, is based on an internal “units viewed” metric that combines all our content forms: online training courses, books, videos, Superstream online conferences, and other new products. It includes content from all of the publishing partners in the platform, not just O’Reilly. Results in each group of topics are normalized to 1, so items within the same group can be compared (Java to Python but not Java to Ethereum, for example).
O’Reilly Answers
We’re very excited about O’Reilly Answers, the newest product on the platform. Answers is an intelligent search that takes users directly to relevant content, whether that’s a paragraph from a book, a snippet of a video, or a block of code that answers a question. Rather than searching for an appropriate book or video and skimming through it, you can ask a specific question like “How do you flatten a list of lists in Python?” (a question I’ve asked several times). Our approach to Answers was to do a simple “bag of words” analysis: count the number of times each word was used in all Answers queries. We divided Answers questions into two categories: “organic” queries, which users type themselves, and “question bank” queries, which are sample questions that users can click on. (Questions were rotated in and out of the question bank.) Our analysis only included organic questions; we didn’t count clicks on the question bank. What’s perhaps surprising is that many users typed questions from the question bank into the Answers search bar. These retyped questions were counted as organic queries.
That explains the most commonly asked question on Answers: “What is dynamic programming?” That question appeared frequently in the question bank. It was evidently intriguing enough that many users typed it in, verbatim, in addition to clicking on it; it was the second-most-common organically typed question, only slightly behind “How do I write good unit test cases?” (also very popular in the question bank).
Ignoring stop words (like “and”) and significant words that aren’t really meaningful to us (like “good”), the top five words were “data,” “Python,” “Git,” “test,” and “Java.” (And you can see most of the words from those top two questions in the top 15 or 20 words.)
What can we learn from this? Data continues to be one of the most important topics for our users. A quick look at bigram usage (word pairs) doesn’t really distinguish between “data science,” “data engineering,” “data analysis,” and other terms; the most common word pair with “data” is “data governance,” followed by “data science.” “Data analysis” and “data engineering” are far down in the list—possibly indicating that, while pundits are making much of the distinction, our platform users aren’t. And it certainly suggests that data governance (slightly ahead of “data science” itself) is a topic to watch.
Python and Java have long been the top two programming languages on our platform, and this year is no exception. We’ll see later that usage of Python and Java content is very slightly down and that usage of content about Rust and Go is growing rapidly (though it’s still relatively small). The word “programming” was also one of the most frequently used words, reflecting our core audience. And “Kubernetes” was in the top 1%, behind “Java” and “Python” but ahead of “Golang” (top 2%) and “Rust” (4%). The frequency of questions about Kubernetes reflects the importance of container orchestration to modern operations. “AWS,” “Azure,” and “cloud” were also among the most common words (all in the top 1%), again showing that our audience is highly interested in the major cloud platforms. Usage of the term “GCP” and the bigram “Google Cloud” trailed the others, though to some extent that’s because Google has never been clear about the name of its cloud platform. Both “GCP” and “Google Cloud” were in the top 3% of their respective lists.
Words about cryptocurrency (“Bitcoin,” “Ethereum,” “crypto,” “cryptocurrency,” “NFT”) are further down on the list, though still in the top 20%. That’s not surprising. Elsewhere, we’ll see that the use of content about these topics is rising sharply, but usage still isn’t large. We have no “previous year” data for Answers, so we can’t discuss trends, but the fact that these terms are appearing in significant numbers is certainly important.
That quick dip into the bag of words gives us some clues about what we’ll see when we look at the data in more detail. Now let’s start investigating content usage: what our customers actually read, watched, or participated in during the past year.
Becoming Secure
Security was frequently in the news in 2021, and for the worst possible reasons. A wave of ransomware attacks crippled important infrastructure, hospitals, and many other businesses, both large and small. Supply chain attacks, in which an attacker places a payload in software that’s delivered to its victim through normal distribution channels, occurred in both open source and commercial software. In one notable case, the victim was a well-known enterprise security company, whose infected software was distributed to thousands of clients.
We saw large increases for content about specific topics within security. Usage of content about ransomware has almost tripled (270% increase). Content about privacy is up 90%; threat modeling is up 58%; identity is up 50%; application security is up 45%; malware is up 34%; and zero trust is up 23%. Safety of the supply chain isn’t yet appearing as a security topic, but usage of content about supply chain management has seen a healthy 30% increase. The increase for content on identity is a particularly important sign. Identity management is central to zero trust security, in which components of a system are required to authenticate all attempts to access them. Understanding identity management is a big step toward putting zero trust security into practice.
Usage of general content also increased. Units viewed for items with the word “security” or “cybersecurity” in the title increased by 17% and 24%, respectively. Network security, also a general topic, increased 15%. While these increases are relatively modest compared to specific topics like ransomware and privacy, keep in mind that in absolute numbers, the usage of “security” titles led all other security topics by a large margin. And a 17% increase in an established topic is very healthy.
Another important sign is that usage of content about compliance and governance was significantly up (30% and 35%, respectively). This kind of content is frequently a hard sell to a technical audience, but that may be changing. While compliance and governance are frequently mentioned in the context of data and privacy, it’s important to realize that they’re central issues for managing security. What are an organization’s responsibilities if it suffers a breach or an attack? Has the organization managed its data responsibly? This increase points to a growing sense that the technology industry has gotten a regulatory free ride and that free ride is coming to an end. Whether it’s stockholders, users, or government agencies who demand accountability, enterprises will be held accountable. Our data shows that they’re getting the message.
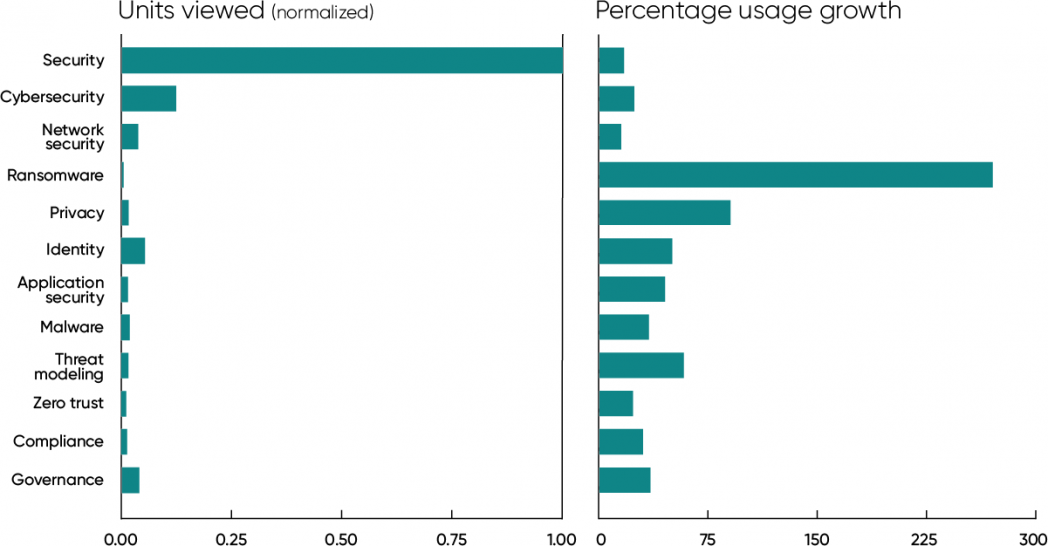
According to a study by UC Berkeley’s School of Information, cybersecurity salaries have crept slightly ahead of programmer salaries in most states, suggesting increased demand for security professionals. And an increase in demand suggests the need for training materials to prepare people to supply that demand. We saw that play out on our platform. Looking for titles matching security certifications proved to be a poor metric (probably because long, unwieldy certification names do poorly in titles), but when we look at our content taxonomy rather than title searches, we see that SSCP (System Security Certified Practitioner) is up 54%, and CompTIA Security+ is up 27%.
Software Development
Software development is a mega category on the O’Reilly learning platform. It includes almost everything, from programming languages to cloud to architecture and more. While it’s customary to start with a rundown on the programming language horse race, we won’t do that. Whether Python leads Java or not just isn’t interesting (though we will have a few words to say about that later on).
The most interesting topic within software development hasn’t yet made it to our platform. Everyone is talking about developer experience (DX): what can be done to make life better for software developers. How can their jobs be made more enjoyable, helping them to become more effective? That’s an issue that will become increasingly important as organizations try to keep programmers from jumping ship to another company. While we don’t yet have any content on developer experience, we’d be surprised if there isn’t some next year. For one source of ideas about where developer experience is headed, look at our report Low Code and the Democratization of Programming. In it, we tried to take a longer view—examining not what trends will change programming next year but what we might see five or ten years from now.
Software architecture, Kubernetes, and microservices were the three topics with the greatest usage for 2021. Their year-over-year growth is also very healthy (19%, 15%, and 13%, respectively). It only looks small when compared with the growth of topics like API gateway (218%). That kind of growth reflects the “law” we’ve observed throughout this report: it’s easy for a small topic to have large growth numbers but much more difficult for a topic that’s already dominant. API gateway content gets roughly 1/250 as many units viewed as content on architecture or Kubernetes does.
However, we want to be clear: while API gateway’s usage numbers are relatively small, 218% growth is a very strong signal. So is the growth in cloud native (54%), starting from significantly more units viewed in 2020 (roughly 1/8 of architecture or Kubernetes). Enterprises are investing heavily in Kubernetes and microservices; they’re building cloud native applications that are designed from the start to take advantage of cloud services. And API gateways are an important tool for routing requests between clients and services.
In this context, it’s no accident that content usage for containers shows significant growth (137%), while Docker shows less growth but higher usage. Containers are proving to be the best way to package applications and services so that they’re platform independent, modular, and easily manageable. We don’t want to understate the difficulty of moving to containers and using tools from the Kubernetes ecosystem to manage them, but remember that a few years ago, enterprise applications were monoliths running on a small number of servers and managed entirely by hand. Many businesses have now scaled an order of magnitude or so beyond that, with hundreds of services running on thousands of servers in the cloud, and you’ll never succeed at that scale if you’re starting and stopping servers and services by hand. We’re still exploring this transition, and it will continue to be a big story for the next few years.
When we’re talking about microservices running in the cloud, we’re talking about distributed systems. So it’s no surprise that usage of content about distributed systems rose 39% in the past year. The related topics complex systems and complexity also showed significant growth (157% and 8%). It’s also worth noting that design patterns, which fell out of favor for a few years, have come back: usage is very solid and year-over-year growth is 19%.
Quantum computing remains a topic of interest. Units viewed is still small, but year-over-year growth is 39%. That’s not bad for a technology that, honestly, hasn’t been invented yet. Although some primitive quantum computers are available now, computers that can do real work are still several years away. (IBM’s roadmap has 1,000-physical-qubit computers coming in two years, though the best estimate is that we’ll need 1,000 physical qubits to create one error-corrected qubit.) But when those computers arrive, there will clearly be people ready to program them.
We’ve said almost nothing about architecture, except to notice heavy usage and solid growth. All this ferment—rebuilding legacy applications, moving to the cloud, microservices, orchestration—doesn’t happen without good, consistent software design. Success with microservices is impossible without giving serious thought to designing good APIs for your services to present to each other and, in turn, to the rest of the world. The problem with legacy applications is that they’re inflexible: they leave you stuck with the capabilities you had 20 years ago. If you replace your old legacy software with new legacy software that doesn’t have the ability to evolve as your needs and opportunities change, if you build something that’s just as inflexible as what it replaced, what have you accomplished? This is where software architecture comes into play: how do teams build systems that aren’t just adequate for today but that will be flexible enough to grow with the business? Solid year-over-year growth and heavy usage is exactly what we’d expect to see.

Finally, last year we observed that serverless appeared to be keeping pace with microservices. That’s no longer true. While microservices shows healthy growth, serverless is one of the few topics in this group to see a decline—and a large one at that (41%).
Programming Languages
We’ve said many times that we’re uninterested in the language horse race. Usage of well-established programming languages changes very slowly year to year. Occasionally a language breaks out of the pack, but that’s rare. We’d go so far as to say it’s less of a horse race than a turtle race—a turtle race in which a language that’s slowly gaining traction in the enterprise space can gradually come to dominate the cool language du jour.
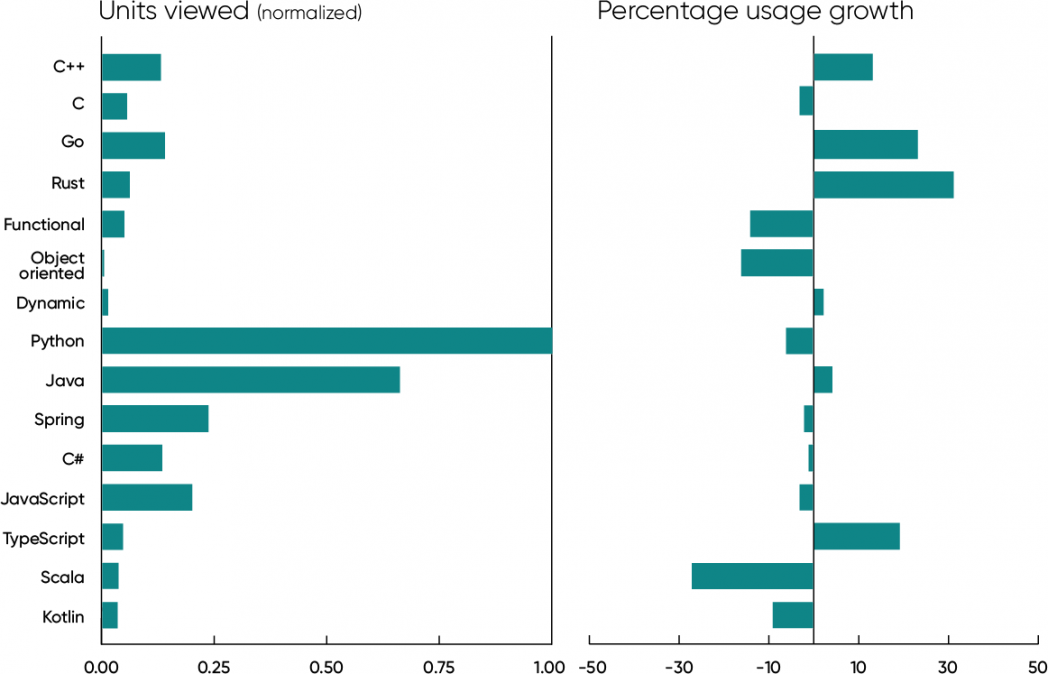
So we’ll avoid the horse race entirely and focus on possible reasons for any changes. What are the important changes since last year? C++ has grown significantly (13%) in the past year, with usage that is roughly twice C’s. (Usage of content about C is essentially flat, down 3%.) We know that C++ dominates game programming, but we suspect that it’s also coming to dominate embedded systems, which is really just a more formal way to say “internet of things.” We also suspect (but don’t know) that C++ is becoming more widely used to develop microservices. On the other hand, while C has traditionally been the language of tool developers (all of the Unix and Linux utilities are written in C), that role may have moved on to newer languages like Go and Rust.
Go and Rust continue to grow. Usage of content about Go is up 23% since last year, and Rust is up 31%. This growth continues a trend that we noticed last year, when Go was up 16% and Rust was up 94%. Is the decline in Rust’s rate of growth a concern? Don’t let the second derivative fool you. Last year Rust content was starting from near-zero and 90% growth was easy. This year it’s well-established (I don’t think we’ve ever seen a language establish itself quite so quickly), and we expect growth to continue. Both Rust and Go are here to stay. Rust reflects significantly new ways of thinking about memory management and concurrency. And in addition to providing a clean and relatively simple model for concurrency, Go represents a turn from languages that have become increasingly complex with every new release.
We see less of the “functional versus object oriented” wars than we have in the past, and that’s a good thing. Both topics are down (14% and 16%, respectively). Functional features have been integrated into Java, C#, and a number of other languages, so the only real question to debate is how much of a purist you want to be. But that’s a distraction—our customers want to get their work done.
Having said all that, what about the “old guard”? They’re nice and stable. Python, Java, and JavaScript are still the leaders, with Java up 4%, Python down 6%, and JavaScript down 3%. (“Python” and “Java” are both in the top five words used in O’Reilly Answers.) Although any change under 10% is small in the greater scheme of things, we’re surprised to see Python down. And, like last year, usage of Java content is only slightly behind that of Python if you add Spring usage to Java usage. (Spring is a large, all-encompassing group of frameworks in the Java ecosystem, but Spring titles usually don’t mention Java.) C#, a core language on Microsoft platforms, was also stable (down 1% year-over-year).
Scala and Kotlin, two other languages that belong to the Java ecosystem, are both down, 27% and 9%, respectively. Scala’s drop is particularly noteworthy. That may reflect the release of Scala 3.0 in May 2021, which would tend to make content based on Scala 2 obsolete.
Use of JavaScript content on our platform is surprisingly low—though use of content on TypeScript (a version of JavaScript with optional static typing) is up. Is TypeScript replacing JavaScript? We’ll see in a few years. Even with 19% growth, TypeScript has a ways to go before it catches up; TypeScript content usage is roughly a quarter of JavaScript’s. The relatively low usage of JavaScript on our platform may reflect our enterprise-centered audience, large numbers of whom work on backend and middleware services. Our data is similar to TIOBE’s (in which the top languages are Python, C, and Java) and sharply different from RedMonk’s (in which JavaScript leads, followed by Python and Java).
In our 2021 Data/AI Salary Survey, we noted that most respondents used more than one programming language. That’s certainly true of our audience as a whole. We also discovered that Python programmers had midrange salaries, while the highest salaries went to respondents who used Go, Rust, and Scala. Our interpretation was that Python has become table stakes. If you work with data, you’re expected to know Python; the ability to work with one of these other languages gives you added value. While we don’t have salary data for platform users, we suspect the same is true. If you work on enterprise or backend software, Java is table stakes; if you do frontend development, JavaScript is table stakes. But whatever your specialty or your primary language, fluency with next-generation languages like Go and Rust gives you added value.
One final final note and then we’ll move on. When we looked at our analysis of O’Reilly Answers, we were puzzled by the top question: “What is dynamic programming?” It seemed strange to see that at the top of the list. Stranger still: while that question was in the question bank, when we removed question bank clicks from the data and looked only at organic questions (questions typed by a user), “What is dynamic programming?” was still at the top. We don’t think this is a rehash of the tired “static versus dynamic” debate of a few years ago; there were no questions about dynamic languages. Dynamic programming is a technique for breaking down complex problems into smaller components. It will clearly be a topic to watch as programmers continue to deal with increasingly complex systems.
Learning About the Cloud
Our data about the cloud and cloud providers tells an interesting story. It’s clear that Amazon Web Services’ competition is on the rise. Usage of content about Microsoft Azure is up 32% and Google Cloud is up 54%, while the usage of AWS-related content has declined by 3%. Actual usage of content about Azure almost matches AWS, while Google Cloud is farther behind, although that may reflect the quantity of material available.
If we take a step back and look at the term “cloud” in general, we find that content about cloud is slightly larger than content about AWS and has grown 15% since last year. (Keep in mind that a title like Machine Learning in the AWS Cloud would match both terms.) Cloud native—the practice of building applications so that they run first in the cloud and take advantage of cloud services from the start—is up significantly (54%).
We also see another important trend. Usage of content about hybrid clouds and multiclouds is still small (roughly 1/10 of that of Google Cloud, the smallest of the major cloud providers), but growing very fast (145% and 240%, respectively). We won’t split hairs about the difference between a hybrid cloud and a multicloud; there’s enough confusion in the marketplace that, for all practical purposes, they’re identical. But we can say that multicloud and hybrid cloud approaches both reflect a fundamental reality: it’s difficult, if not impossible, to build a cloud strategy around a single provider. Cloud deployments aren’t top-down. They start with a research experiment here, a marketing project there, a group that’s frustrated with the time it takes to requisition hardware, and so on. Sooner or later, you have a cloud deployment—or, more likely, six or seven completely different deployments. By the time someone starts to build a high-level cloud strategy, the organization is already using two or three of the major cloud providers. They are already multicloud, whether or not they realize it. An important part of building a cloud strategy is recognizing that the “cloud” is inherently multi- (or hybrid) and that the biggest issue isn’t which provider to choose but how to build an effective cloud infrastructure across multiple providers. That’s an important aspect of becoming cloud native.

Stable as the Web
The core technologies for web programming have been very stable over the last two years. Usage of content about core components HTML, CSS, and JavaScript is almost unchanged (up 1%, up 2%, and down 3%, respectively). If Java and Python are table stakes for enterprise and data developers, so much more so are HTML, CSS, and JavaScript for frontend developers. They’re the foundational technologies for the web. If you’re not fluent with them, you’re not part of the conversation.
PHP is hardly a new technology—any PHP user will tell you that almost 80% of the web is built with it. The use of content about PHP is up 6%, which doesn’t tell you how many jobs there are or will be but does mean that PHP isn’t leaving anytime soon. The use of content about jQuery (another older technology that’s often used in conjunction with PHP) is up 28%. And interest in web design, a perennial topic that will never go away, is up 23%.
Among the newer frameworks and meta frameworks, Svelte seems to be thriving (up 71%, though from a very low starting point), while interest in Vue and Next.js seems to be fading (down 13% and 13%). Svelte may become a challenger to the more widely used frameworks in a few years if this keeps up. There was surprisingly little interest in Jamstack. That may be because the term rarely appears in the title of books or training, though searches for the term “Jamstack” were also infrequent.
Usage of content about the React framework is also essentially unchanged this year (up 2%), while Angular framework content usage is down significantly (16%). It’s probably just coincidental that JavaScript and React usage are almost identical.
In the Pythonic corner of the web development space, Django is holding steady: the number of units viewed is healthy (and greater than Flask, Svelte, or Vue), and we saw no change year-over-year. Usage of content about Python’s Flask framework is headed downward (12% decline). Likewise, the most widely known Ruby framework, Rails, is down 19%.

AI, ML, and Data
There’s been a lot of speculation in the press about artificial intelligence. Are we heading into another “AI winter”? Is it an important technology for today, yesterday’s fad, or something impossibly far off in the future? To some extent, this kind of speculation comes with the territory, especially since Gartner published its famous “hype curve.” AI has certainly been hyped. But is it heading into the so-called “trough of disillusionment”?
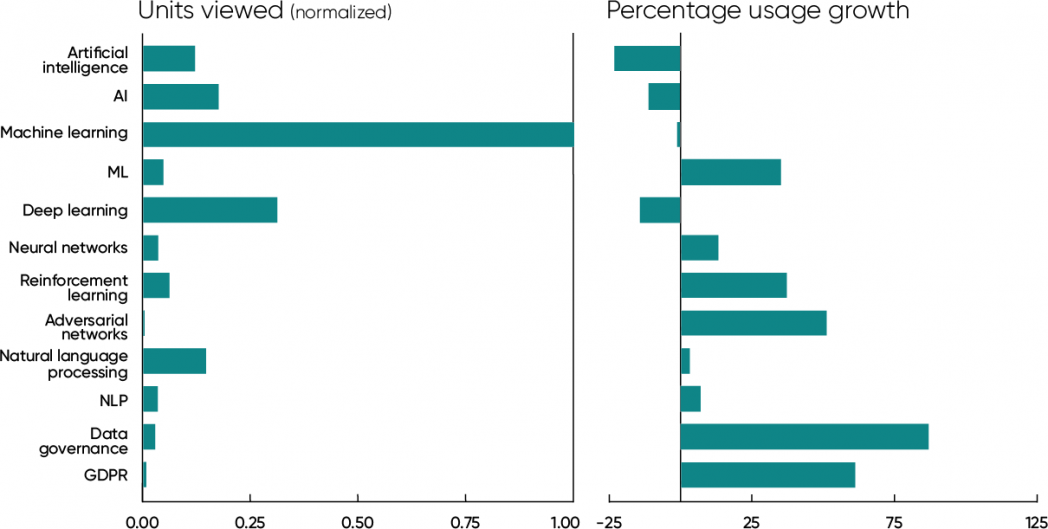
We’d say no. That’s not what our data shows. Yes, usage of content with “artificial intelligence” in the title is down 23% in 2021, and “AI” is down 11%. But these topics are relatively small and narrow. The topic that clearly dominates this space is machine learning (ML): usage of AI plus artificial intelligence content is roughly 1/4 of ML plus machine learning.
What’s the difference between AI and ML? For the purposes of this report, we define machine learning as “the part of artificial intelligence that works”—and, implicitly, the part of AI that’s being put into practice now. AI is, by nature, a research topic. While we have plenty of researchers among our members, our core audience is programmers and engineers: people who are putting technology into practice. And that’s the clue we need to make sense of this puzzle.
Usage of content with “machine learning” in the title is flat year-over-year (down 1%, which is noise). Usage of content with “ML” in the title is up 35%. There are more titles with the phrase “machine learning”; if you add the two up, you get a very slight gain. Still noisy, but positive noise rather than negative. We don’t expect another AI winter—AI is too solidly entrenched in online business practices, and in ways that aren’t as visible as social media recommendations; you’ll never know (or care) whether the company that makes your espresso machine is using machine learning to optimize the manufacturing process and manage inventory, but if they aren’t now, they will be. However, it’s worth noting that AI and ML were the natural outgrowths of “big data” and “data science,” both terms that are now in decline. Big data, of course, never ended; it evolved: just look at the training data needed to build an AI model. The question for the coming year, then, is whether machine learning and artificial intelligence will “evolve”—and if so, into what?
Now let’s look at some specific techniques. Usage on deep learning is down 14%, but usage on neural networks is up 13%, reinforcement learning is up 37%, and adversarial networks is up 51%. Interest has clearly shifted from general topics to specific ones.
Natural language processing has been very much in the news. As was the case for machine learning, usage of content with “natural language processing” in the title hasn’t changed much (up 3%); the abbreviation “NLP” is up 7%. Again, we can look at some of the new techniques that have made the news. The platform had no content on Transformers, BERT, or GPT back in 2020. All three are now coming onto the map. Similarly, there’s currently no content on GitHub Copilot, which uses the GPT-3 model to translate comments into working code, but we expect it to be a strong performer in 2022.
So what can we conclude? General topics like AI, ML, and GPT are holding their own with content usage or are down. However, usage of content about specific techniques like adversarial networks and reinforcement learning is growing. And content for the newest techniques, like BERT and Transformers, is only now starting to appear. That doesn’t look like a slide into disillusionment but like the natural consequence of a field that’s moving from theory into practice.
It’s also worth looking at the significant increase in the use of content about data governance (up 87%) and GDPR (up 61%). Everyone working with data should know that data governance and its related topics (data provenance, data integrity, auditing, explainability, and many other specialties) aren’t optional. Regulation of the use of data isn’t some vague thing off in the future. It’s here now: GDPR (the EU’s General Data Protection Regulation) is in effect, as is California’s Consumer Privacy Act (CCPA). Now is the time to start thinking about data governance—not later, when it will certainly be too late. Data governance is here to stay, and our platform shows that data professionals are learning about it.
Databases
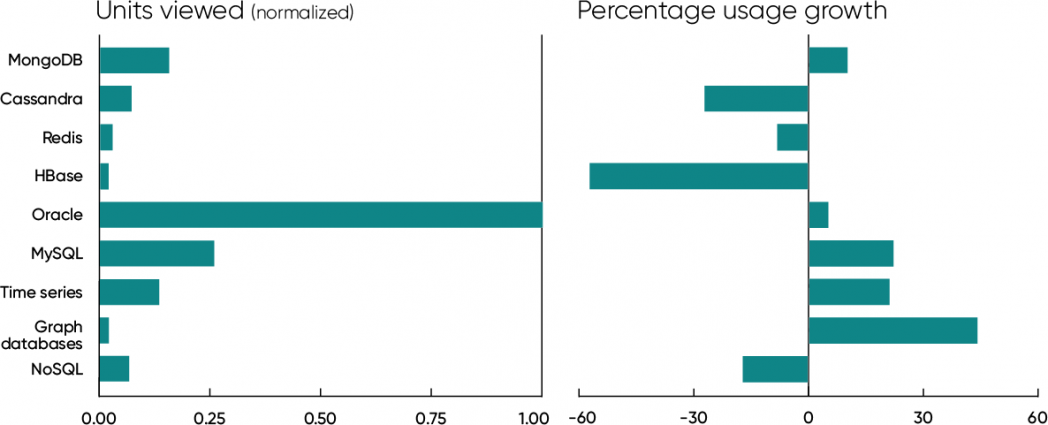
You can’t talk about machine learning without talking about data and databases. It’s no surprise that, when we look at content usage, Oracle is leading the pack. It’s also no surprise that Oracle’s growth is slow (5%); as we often observe, rapid growth is most often associated with smaller, newer topics. Usage of content about the open source MySQL database (now owned by Oracle) is roughly 1/4 as high and has grown substantially (22%).
It’s worth looking at alternatives to Oracle though. We’ve heard about the death of NoSQL, and certainly usage of content about NoSQL is down (17%). But that isn’t a good metric. NoSQL was never a single technology; databases like Cassandra, HBase, Redis, MongoDB, and many others are wildly different. NoSQL is really more a movement than a technology—one that’s devoted to expanding the number of storage options for system designers. A good understanding of NoSQL means realizing that for most applications, relational databases are a good fit.
Of the more established NoSQL databases, MongoDB shows 10% growth. Cassandra, Redis, and HBase have declined sharply (27%, 8%, and 57%, respectively). Together, the four show total usage about 40% greater than MySQL, though the total for all four has declined somewhat (4%) since 2020. Momentum has clearly shifted from the NoSQL movement back to relational databases. But that isn’t the end of the story.
We’ve been following graph databases for some time, and in the last year, they’ve gotten a lot of press. But it’s difficult to discuss specific graph databases because most established database vendors have a graph database product integrated into their offering. That said, use of content with the term “graph databases” is up 44%. It’s still a small category, but that’s a significant signal.
Likewise, usage of content about time series databases (databases that associate every entry with a time stamp) is up 21%. Time series databases may prove important for applications stressing monitoring, logging, and observability. Using AI to analyze logs and detect malicious activity is one such application.
Relational databases still dominate the database world, and there’s no reason to expect that to change. Nor should it. The promise of NoSQL wasn’t replacing relational databases; it was increasing the number of options available. The rise of graph and time series databases are simply examples of this promise in action. It will be interesting to see whether this trend continues into 2022.
Operations, DevOps, and SRE
Operations is “up and to the right.” Very few topics in this group saw declines since last year, and a lot had big gains. As we said last year, it doesn’t really matter what you call operations: call it DevOps, call it SRE, call it George…this is the task of running the servers, managing software deployment, and keeping the business online. As many found out firsthand during the pandemic, keeping the servers running is crucial, not just to support staff working from home but also to move as much of the business as possible online. People have said “every business is an online business” for years now, but in the past year, that really became true. If your business wasn’t online when COVID-19 hit, it could have easily ceased to exist. Add to that the staffing pressures caused by illness and by resignations or job changes, and it quickly became clear that there’s a real need to do more with less. IT groups found themselves doing much, much more with fewer team members than before. The answer to these challenges is automation (to allow fewer people to manage more systems) and reliability engineering (reducing downtime to reduce staff stress).
We saw substantial increases in the use of titles with the words “observability” (up 124%), “container” (137%), “CI/CD” (109%), “monitoring” (up 36%), and “testing” (16%). A 36% increase for monitoring is very healthy, but the much larger increase for observability shows that this concept is winning people’s hearts and minds. In practice, many find the difference between observability and monitoring confusing. Observability ultimately boils down to the ability to find the information you need to analyze a system’s behavior, while monitoring refers to logging and watching certain preconfigured parameters that indicate the system’s health. It’s a subtle difference—one way to think of it is that monitoring tells you when something’s wrong, but observability gives you the data needed to debug unexpected or strange failure modes, predict failures more reliably, and understand system performance in depth.
CI/CD (continuous integration and continuous deployment) is the latest stage in a long trend of improved tools for automating the development and deployment process, starting way back in the 1970s with Unix’s make utility (for building software) and adding automated testing tools in the early 2000s (JUnit and its relatives) and automated deployment tools a few years later (Jenkins). We now build pipelines that automate the path from the programmer to the server. In the early days of the O’Reilly Velocity Conference, we heard about how companies could build, test, and deploy software many times per day. Automating the deployment process makes it much faster and more reliable, in turn making IT staff more effective because they no longer have to shepherd code “by hand” from the developer’s laptop to the production servers. CI/CD has now become standard practice for almost every online business. It’s something the enterprises that are just moving online, or just moving to the cloud, need to understand to get the most out of their staff.
“Testing” appears to be lagging other terms in this group, but it’s worth noting that the most frequently asked question on O’Reilly Answers was “How do I write good unit test cases?” The practice of automated testing, integrated into the deployment process, is one of the foundations of modern operations. If a software release doesn’t pass all of its tests, it can’t be deployed. That practice gives software developers the confidence to move fast without breaking things.
We’ve also seen increases in content about the tools used to deploy software. Git is up 44%, Kubernetes is up 15%, Docker is up 5%, and Terraform is up 6%. Kubernetes led all topics in this category in units viewed. Furthermore, the two most popular Kubernetes certifications, Certified Kubernetes Application Developer (CKAD) and Certified Kubernetes Administrator (CKA), were up 24% and 13%, respectively. Docker’s relatively low growth may be attributed to the standardization of container formats (the Container Runtime Interface, or CRI), and the removal of Docker as a requirement for Kubernetes. There are now viable alternatives to Docker.
It’s worth looking a bit more at the Kubernetes ecosystem. While usage of content about Kubernetes is up 15% and Helm (Kubernetes’s package manager) is up 68%, usage of content about Istio (a service mesh, an important part of the Kubernetes ecosystem) is sharply down (46%). At first glance, this is confusing: why would Kubernetes and Helm be up, while Istio is down? It’s possible that open source politics around Google’s control over Istio hurt its adoption, though we suspect that only had a small effect. You’ve probably heard that Kubernetes has a steep learning curve; if you’re a developer, you may have experienced that yourself. Istio said, “Hold my beer, you haven’t seen complex yet.” A service mesh is an important part of container orchestration, but Istio is proving to be too complex. Kubernetes has proven essential for managing cloud deployments; Istio hasn’t.
Both Kubernetes and Istio originated at Google and were designed to solve Google-scale problems. But very few businesses—even those that any reasonable person would call “large”—need to manage IT infrastructure at Google’s scale. Will we eventually have container orchestration tools that solve problems for businesses that aren’t as huge as Google? Work on the Service Mesh Interface (SMI), a standard interface between service mesh software and Kubernetes, may allow a new generation of service mesh implementations to arise; we hope some of those will be simpler.
Three tools are sharply down: Chef, Puppet, and Ansible (27%, 38%, and 20%). In last year’s report, we showed that the decline of these automated configuration management tools coincided with the rise of Docker and Kubernetes. That decline continues.
What about the top-level terms “operations,” “SRE,” and “DevOps” themselves? Usage of titles containing those words was up (7%, 17%, and 2%, respectively), though obviously these increases are smaller than we saw for tools or concepts. As with AI, we may be seeing this part of the industry mature: our customers are less interested in introductory content about the high-level concepts and more interested in specific ideas and tools that they can use in their businesses. It’s also worth highlighting the 2% increase for DevOps. Our 2020 report showed DevOps down 17% from 2019 to 2020. In 2021, that slide has stopped. Over time, we expect that terms like DevOps and SRE will come and go, but the concepts and the tools that they introduced will be with us long-term.
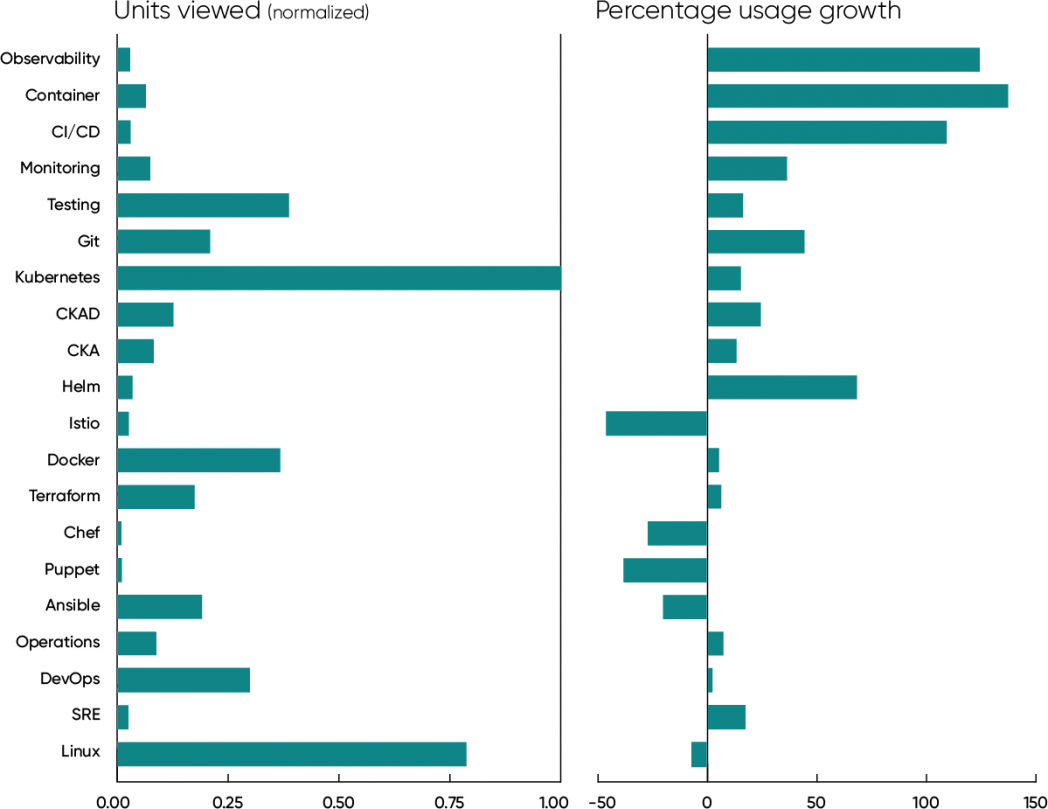
Finally, look at the units viewed for Linux: it’s second only to Kubernetes. While down very slightly in 2021, we don’t believe that’s significant. Linux has long been the most widely used server operating system, and it’s not ceding that top spot soon. If anything, its importance has increased: Linux is the standard operating system for the cloud. Even on Azure, Linux dominates. Solid knowledge of Linux is essential for anyone working in operations today.
Cryptocurrency and Blockchain
Now we’ll look at some ideas that have exploded in the last year. They aren’t necessarily new, but for various reasons they’ve taken off. Our data on these topics tends to be hazy. And, in Arlo Guthrie’s words, many of these topics have “come around on the guitar” one or more times in the past only to fade back into the noise.
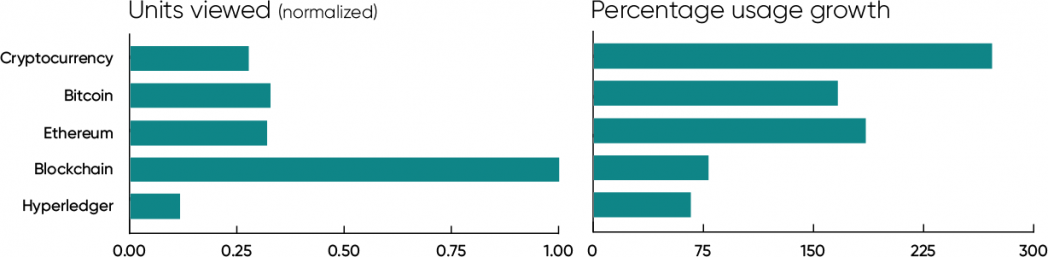
Whether it’s the future of finance or history’s biggest Ponzi scheme, use of content about cryptocurrency is up 271%, with content about the cryptocurrencies Bitcoin and Ethereum (ether) up 166% and 185% respectively. General content about blockchains is up 78%, and from a much higher starting point (reflecting the fact that our audience has more developers than speculators). Hyperledger, a collection of blockchain technologies that targets enterprise markets, is up 66%. Our data doesn’t tell you whether to buy bitcoin or ether, but it does show a huge increase in interest.
We’ve seen a huge increase of interest in nonfungible tokens (NFTs), but there’s where we run into data availability problems. Searches for the term “NFT” are up 4,474%, almost 45 times higher year-over-year. Granted, that’s from an extremely small starting point (only 26 searches in 2019). From that starting point, a 45x increase still takes NFTs to a relatively small endpoint. So which do you believe? A 45x increase or a small endpoint? Take your pick, but our data shows that NFTs shouldn’t be ignored.
Web3 is a collection of ideas about a “next generation” web that’s designed so that it can’t be dominated by a small number of gigantic platforms, like Facebook and Google. Web3 proponents typically mix decentralized protocols like the InterPlanetary File System (IPFS) with blockchains and NFTs to make content immutable and ownable. As with NFTs, no content in our platform has “Web3” in the title. But we’ve seen a 343% increase in the number of searches for the term—again, from a small starting point. We’ve been watching decentralized web technologies for years (we staged a peer-to-peer conference in 2001) and wonder whether the connection between the decentralized web and blockchain will make it take off. Possibly…or possibly not. It isn’t clear what blockchains and NFTs bring to Web3 aside from the hype. We already have a web where anyone can publish. A web where everything has to be owned and where requiring all transactions to pay a tax to blockchain miners isn’t a step forward. We also see no guarantee that a decentralized web couldn’t be dominated by a small number of Google-sized players. We can’t tell you whether Web3 will succeed, but our data shows that it’s becoming an idea worth watching.
Virtual Reality, Augmented Reality, and the Metaverse
Virtual and augmented reality are also topics we’ve been tracking for years. They’ve often seemed at the point of breaking out, but they’ve never made it, at least in part because nobody wants to hang around wearing goggles all the time. Google Glass looked like it had a chance back in 2013, and it survives to this day in an enterprise edition, but it never achieved widespread use. Startups like Oculus (now part of Meta) have made VR goggles aimed at consumers, but they’ve never broken beyond a small segment of the gamer market.
What about this year? We still think VR and AR are on their way. Mark Zuckerberg kicked off a storm by talking about “the metaverse” back in July, and by more recently renaming Facebook “Meta.” Microsoft and many other companies have followed suit by announcing their versions of the metaverse. Apple’s been quiet, but the company is working on augmented reality glasses. (What little we’ve heard sounds like an update of Google Glass with current technology—but if any company’s core expertise is making something cool, it’s Apple.)
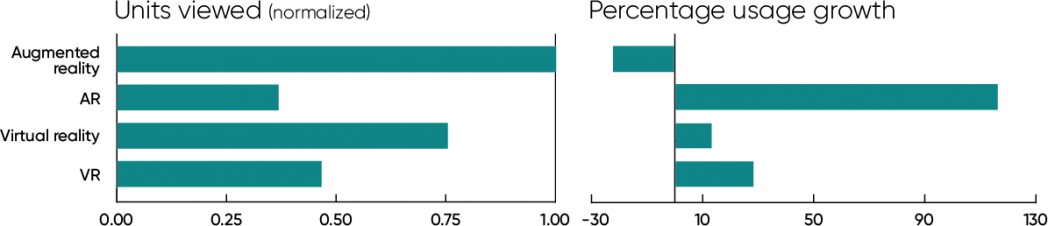
Has all this ferment shown up in our platform data? Keep in mind that we’re only using data through September (in both 2020 and 2021). The results are ambiguous. Use of titles containing the phrase “augmented reality” is down (22%), and those are the most heavily used titles in this group. But virtual reality, VR, and AR are all up (13%, 28%, and 116%, respectively), yielding a 24% gain across the entire group.
The term “metaverse” hasn’t shown up in any titles, though there’s a sharp increase in the number of searches for it (489%). And content about WebXR, a vendor-neutral standard for rendering 3D content on VR- and AR-capable devices (in addition to pedestrian 2D devices), is now starting to show up. (VRML, an older standard, has vanished from view.) No content on WebXR was available in 2020, but some has appeared in 2021, and searches for “WebXR” have increased by 168%.
We’ll forgive you if you decide to bet against VR. Meta (née Facebook) has dragged its own name through the mud for way too long; while the company might succeed, it’s hard to imagine many people wanting to share video of the intimate details of their life with them. And while Zuckerberg is excited about the metaverse’s potential for “work from home” employees, it’s extremely difficult to imagine that a company will want a video feed of its staff’s activities going to the Meta mothership. But Apple has really become a master of conspicuous consumerism. It’s very hard to bet against them when it comes to making high-tech fashion accessories. Mark us cautiously skeptical.
Until Next Year
So after reviewing over a billion units viewed on over 50,000 items in the O’Reilly learning platform, after looking at a million unique search queries plus a smaller number of queries from Answers, where are we? What can we say about the coming year?
Many events grab attention: GPT-3 generating text that could have been written by humans. Cybercriminals demanding millions of dollars after a ransomware attack. Other newsworthy topics include new technologies like NFTs that are just starting to show up in our data and older technologies like virtual reality that may be on the brink of a surge. And there are even more technologies that get a lot of coverage in the technology press, though they aren’t yet appearing in our data in significant ways: robotic process automation (RPA), digital twins, edge computing, and 5G, to name a few. All of these technologies are important, or might be important, depending on where the future takes us. Some are genuinely exciting; others are rebrandings of older ideas.
The real work of technology isn’t coming up with splashy demos; it’s the hard work of taking these breakthroughs and integrating them into products. It’s coming up with solutions to real problems and deploying those as real-world services. It’s defending your IT infrastructure against attack in the middle of a pandemic. Using natural language models to build customer service systems that are less frustrating for the customer and the customer service agent; auditing loan approval systems to see whether they’re fair; preventing ransomware attacks rather than succumbing to them. It probably won’t make the news if there are 20% fewer successful ransomware attacks in the coming year. After all, few people notice when something doesn’t happen. But all of us will be safer nonetheless.
These are the changes that affect our lives, and these are the kinds of changes we see by looking at the data on our platform. Users learning more about security; customers learning more about architecting software for the cloud; programmers trying to come to terms with concurrency, and learning new languages and techniques to deal with complexity; and much more. We see artificial intelligence moving into the real world, with all the problems and opportunities that entails, and we see enterprises realizing that operations isn’t just a cost center—it’s the lifeblood of the business.
That’s the big picture, which (like a Bruegel painting) is built from many, many people, each doing what they think is important, each solving the problem that they face. Understanding technology—and understanding what the O’Reilly platform tells us—is not really about the flashy events, important though they may be; it’s all about understanding the people who depend on our platform every day and what they need to learn to get on with the task of building their futures.
Footnote
- Last year’s platform report was based on January through August, so the two papers aren’t directly comparable.